For 8+ years, we invested in building Platform Mode as an expert workspace for schedule, risk, and portfolio assurance. Over that time, we turned project controls standards, real project data, and practitioner feedback into tools that feel like working alongside an experienced expert rather than a reporting layer. This foundation is what allows our AI Operator to stay auditable, trustworthy, and aligned with how project teams already work.
Here are the expert foundations we’ve built:
Schedule Essentials: see how work is really progressing
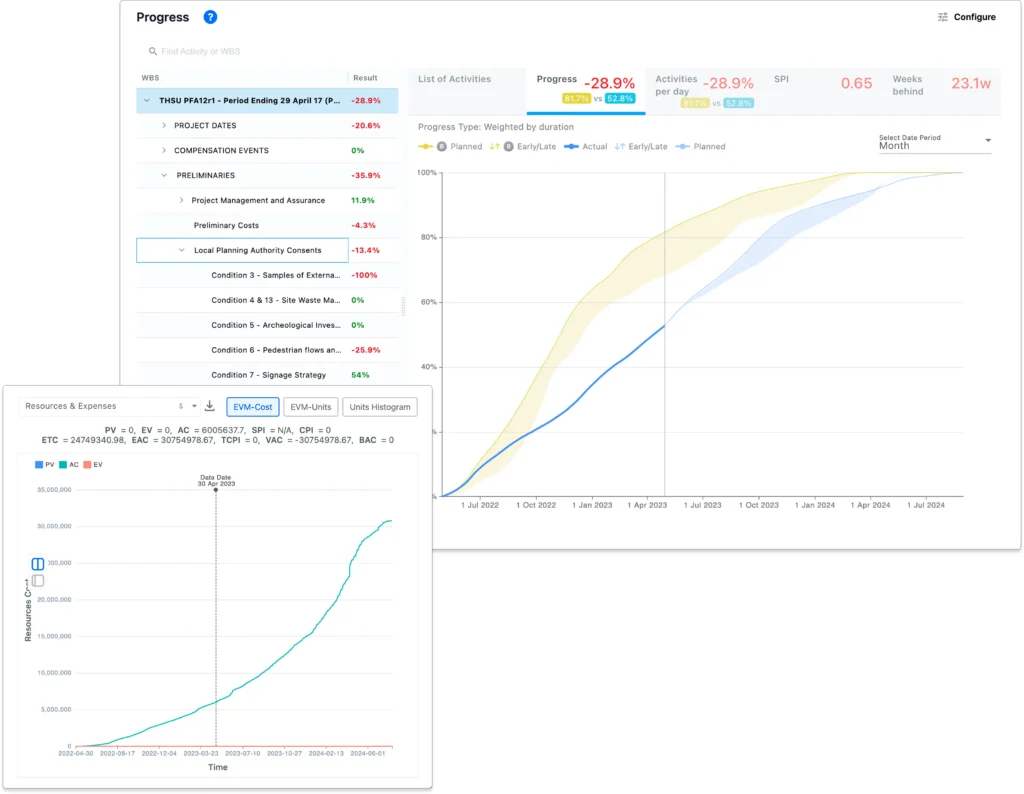
Schedule Essentials turns raw schedule updates into an understandable picture of progress and performance.
- It shows how activities, milestones, and key paths are progressing versus plan, so teams can see whether they are burning down work at the right pace.
- It surfaces performance metrics such as schedule performance indices, slippage, and compression. This helps you answer, “Are we on track, and if not, how far off are we?”.
- It gives project managers and controllers a single place to review current status before they move into deeper change, delay, or risk analysis.
Schedule Integrity: trust the plan you start from
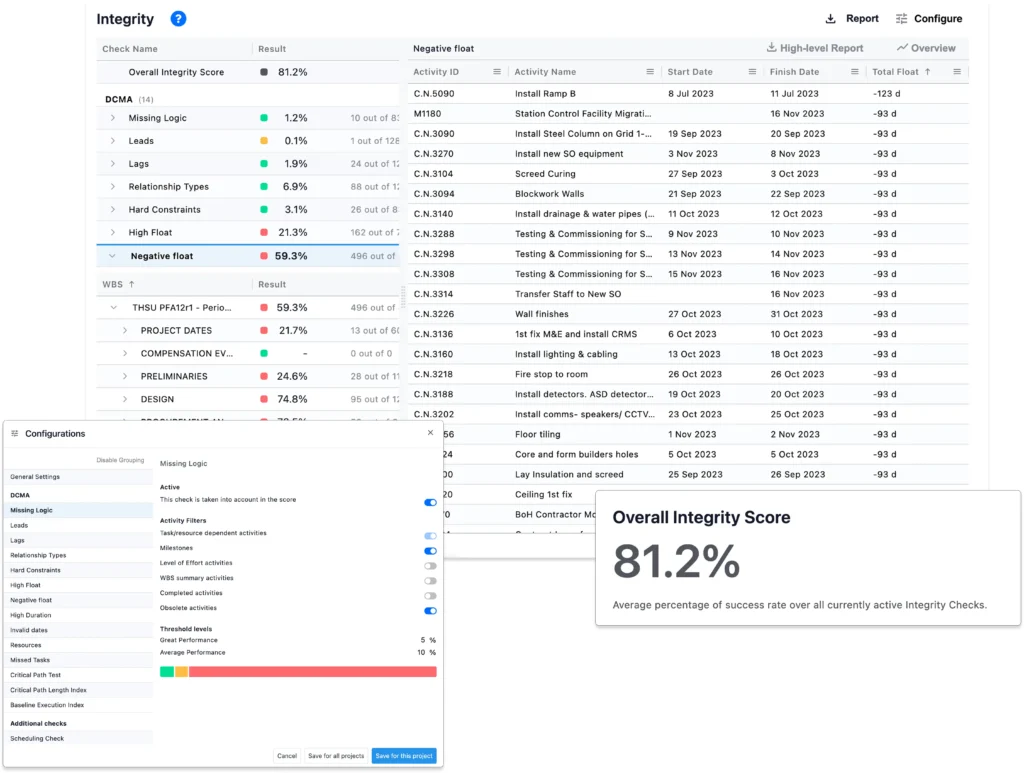
Schedule Integrity focuses on the quality of each schedule before you use it for reporting, forecasting, or AI.
- It highlights logic issues, risky calendars, out of sequence work, and constraint usage so teams can quickly see whether a schedule is fit for purpose.
- It summarizes key integrity indicators, which makes it easier to explain to stakeholders why a plan is strong enough, or where it needs improvement, before committing to it.
Change Control: understand how the plan evolves
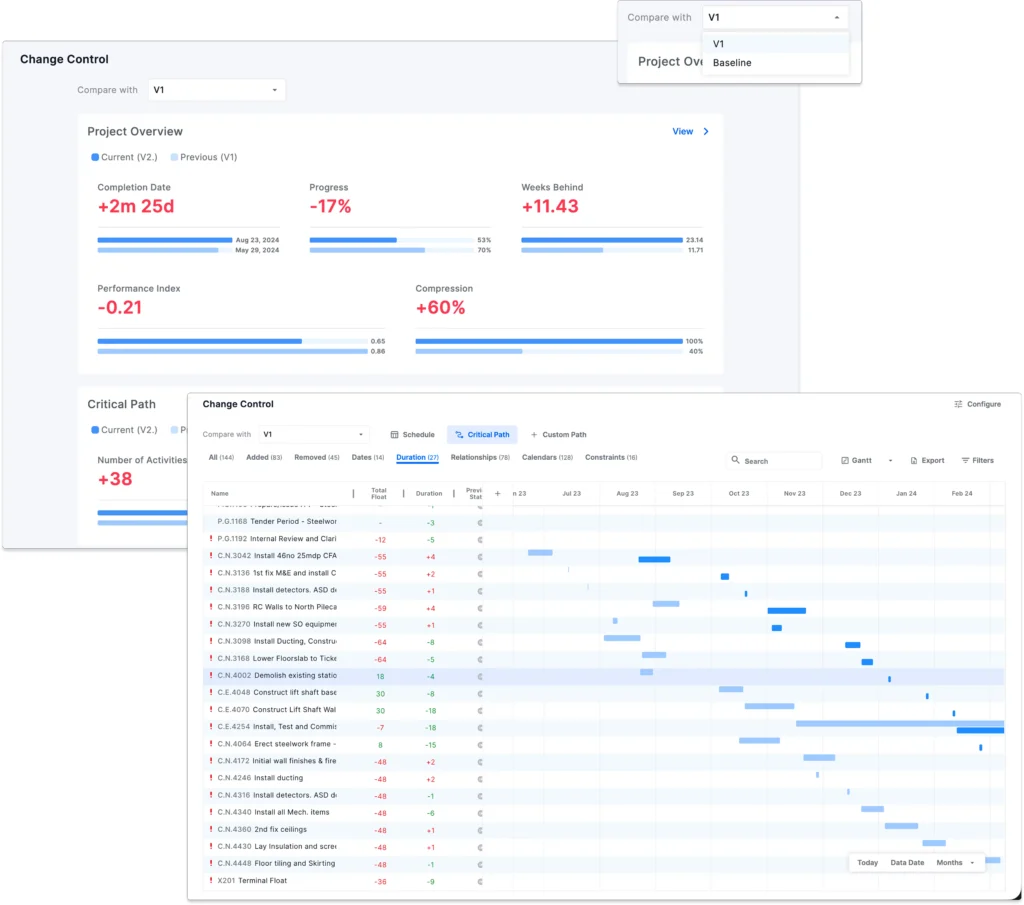
Change Control helps you see how schedules change over time and what that means for delivery dates.
- It compares schedule versions and shows what changed, including added or removed activities, date shifts, duration changes, relationship changes, calendar updates, and constraint changes.
- It connects those changes to completion dates, progress, performance indexes, compression, and the critical path. This gives you a forensic view of how the plan is behaving across updates.
Delay Navigator: trace root causes of delay
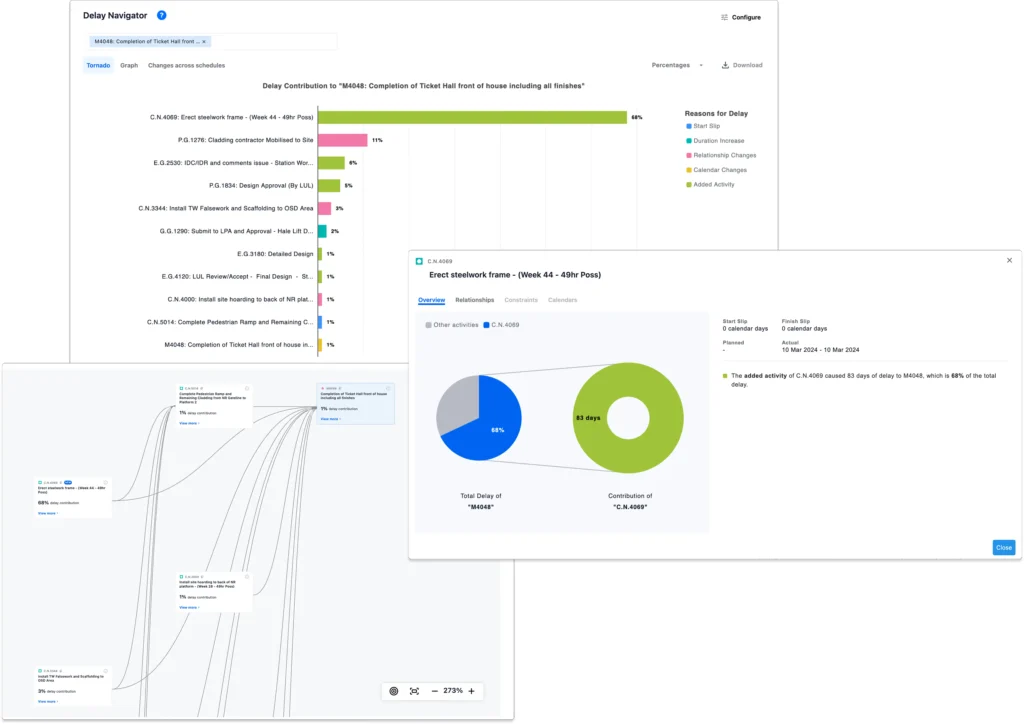
Delay Navigator explains why milestones slipped and which activities drove the delay.
- For any delayed milestone, it traces the chain of predecessor activities and specific changes, such as start slips, duration increases, relationship changes, and added activities, that contributed to the movement.
- It uses visuals like contribution views and network views to show which drivers matter most and how delay propagates through the schedule.
- A tabular view across updates lets you inspect each activity’s changes to start, finish, duration, and total float, so you can see exactly which deltas caused movement versus the baseline or the previous version.
Trends: see how commitments move over time
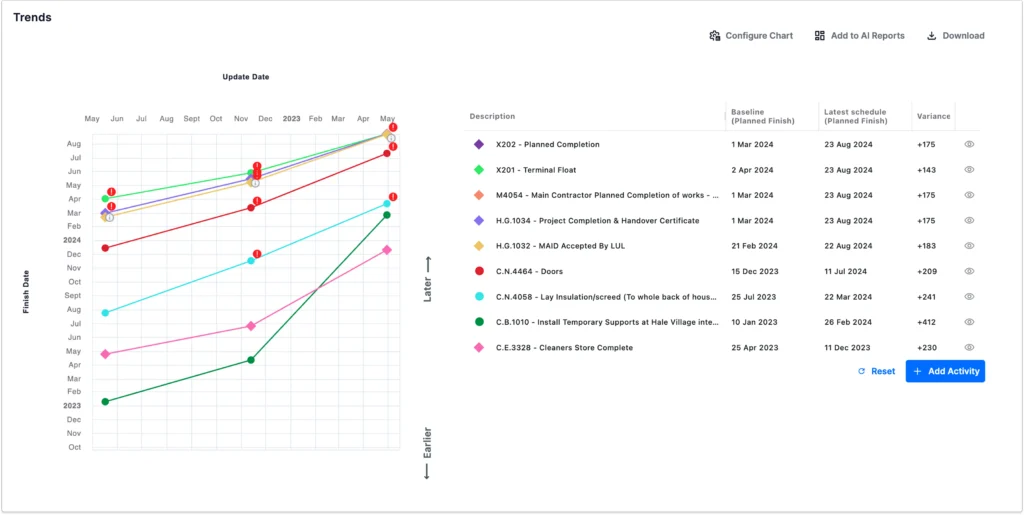
Trends helps you track how critical milestones and activities move across updates.
- You can follow selected milestones over time, see how planned finishes shifted, and compare baseline versus latest schedule dates.
- This makes it easy to show whether commitments are stabilizing, drifting, or improving, and to provide a visual story for governance and steering committees.
Timeline: collaborative Gantt in the cloud
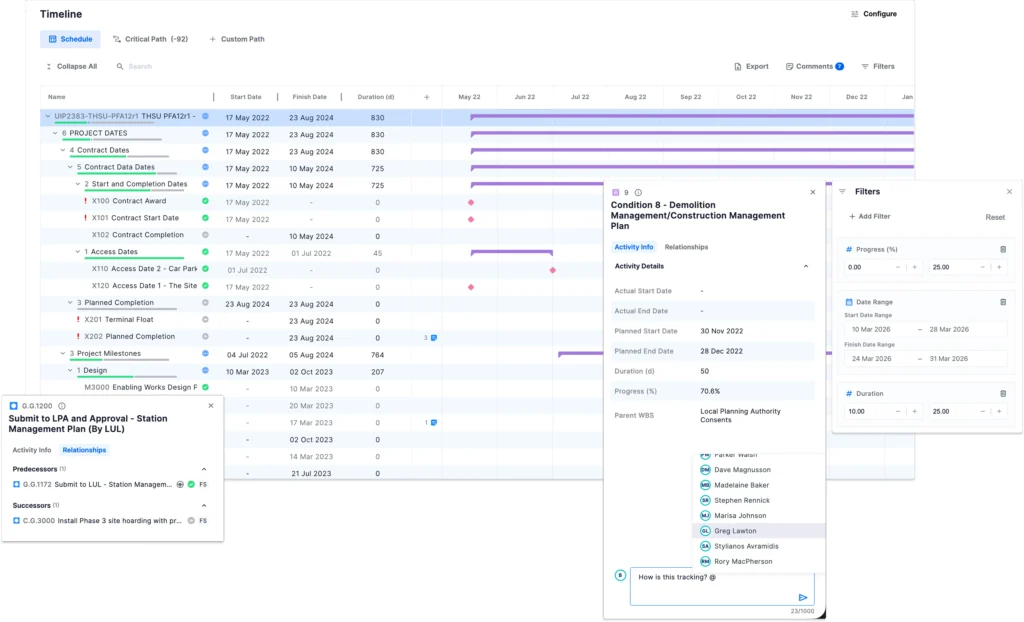
Timeline brings the entire Gantt into the cloud so everyone can see and discuss the plan in one place.
- It offers an interactive Gantt chart that shows activities, milestones, WBS elements, progress, and status.
- Activity details such as actual and planned start or finish, duration, progress, and parent structures are all available in context.
- Powerful filters let you drill down to exactly the part of the schedule you care about.
- Any stakeholder can click an activity, milestone, or WBS and add a comment. Mentions trigger notifications so questions, clarifications, and decisions reach the right people without extra meetings.
QSRA and risk: realistic forecasts and mitigation
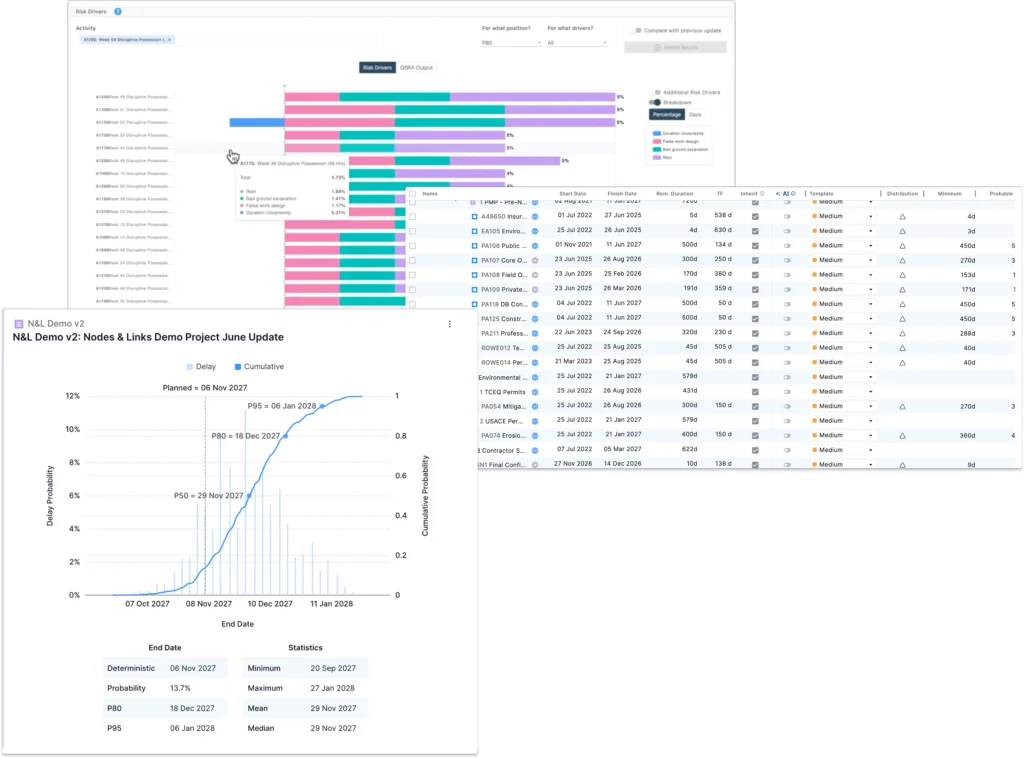
Platform Mode also includes a full QSRA and risk workspace.
- You can assign duration uncertainty to activities and run QSRA with configurable iterations, groupings, and time granularity.
- Duration uncertainty templates make it easy to apply consistent assumptions across large schedules.
- When teams do not have time to manually assign uncertainty everywhere, predictive models can learn from a project’s own history or an entire portfolio’s history and then suggest realistic uncertainty values, helping you better predict actual performance.
- Risk events support pre and post mitigation scenarios so you can test what-if scenarios and see their impact on milestones and project completion.
- Probability curves show the likelihood of hitting target dates based on probabilistic, rather than deterministic, forecasts.
- Risk driver views let you select any activity or milestone and see which upstream activities and uncertainties are driving its risk position. This shows where intervention will have the most effect.
Portfolio: one view of risk and performance across projects
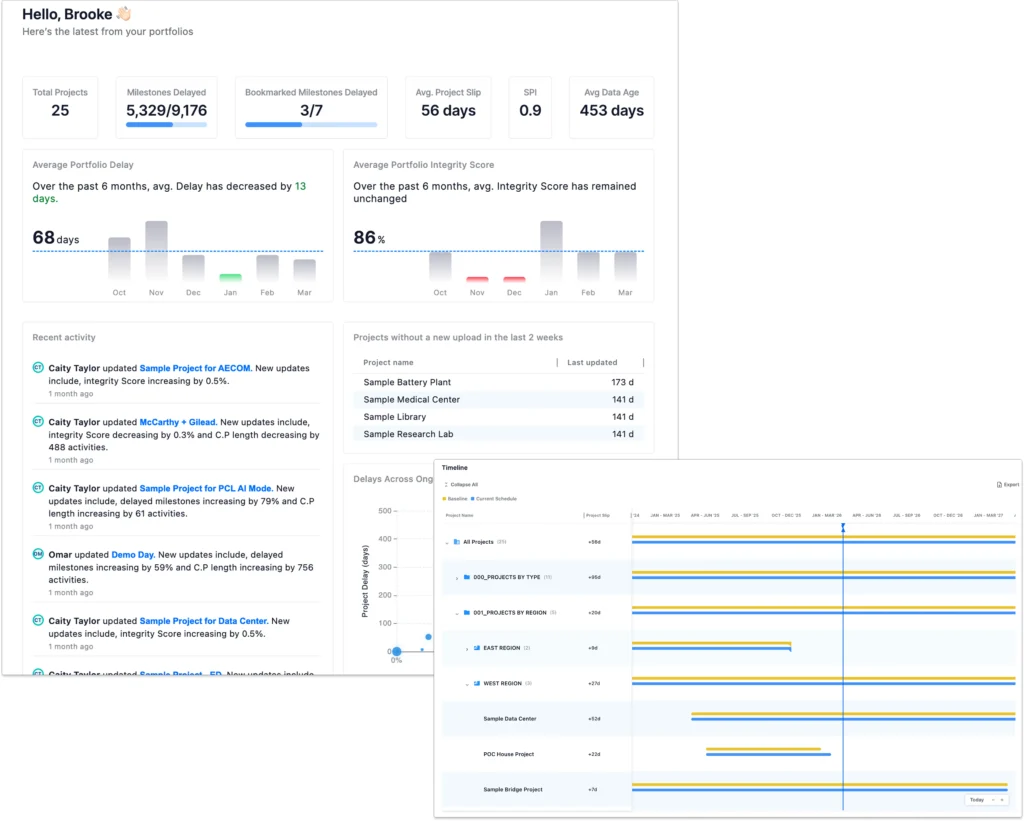
The Portfolio module lets teams step back from individual schedules and see the health of programs and entire portfolios.
- It aggregates integrity, progress, risk, and forecast indicators across projects, so leaders can quickly see which projects are on track and which need intervention.
- It allows grouping and filtering by attributes such as program, region, contractor, or asset type, which helps PMOs focus on the areas that matter most.
- It provides portfolio level trends and metrics, so organizations can spot systemic issues early and track the impact of improvement initiatives over time.
Non-technical foundations: ready for enterprise use
Alongside analytical depth, Nodes & Links 1.0 also established the non functional capabilities that enterprises expect.
- Security and compliance features, such as alignment with ISO 27001 practices, help organizations meet internal and regulatory requirements.
- SSO and role-based access controls make it easy to onboard users, manage permissions, and keep sensitive projects protected.
- APIs and configuration options make it straightforward to connect Nodes & Links with existing scheduling, data, and reporting systems, so the platform fits into established IT and governance frameworks.
Altogether, Nodes & Links 1.0 is the expert and operational backbone of the platform. It is years of schedule, change, delay, risk, portfolio, and enterprise R&D packaged into workflows and capabilities that project teams can rely on every day. This foundation is what makes it possible for our AI Operator to focus on understanding your questions and running the right workflows, while the underlying project controls logic stays consistent and trusted.