
In every major capital project, data is the foundation. If it is wrong, everything that follows is wrong too. Yet, across the industry, data quality remains one of the most overlooked risks in project delivery.
When we talk about data integrity in scheduling, we’re talking about the ability to trust the schedule data that drives decisions. It’s the foundation of every analysis, forecast, and assurance process that follows.
What Data Integrity Means in Scheduling
In scheduling terms, data integrity refers to the quality and reliability of the schedule itself. Specifically, how accurate, logical, and complete it is.
A schedule with strong integrity meets established quality standards such as the DCMA 14-point assessment and extends beyond that baseline. It is free of logic errors, unrealistic durations, and missing dependencies. Tasks are properly linked, calendars are correct, and progress reflects reality.
But true data integrity is not about passing a one-off check. It’s about maintaining schedule health continuously as updates are made. That means validating every new version of the schedule, comparing changes, and ensuring data quality remains consistent across the project and the portfolio.
Why Data Integrity Matters
When data integrity is poor, the consequences are immediate and compounding.
Schedules become unreliable.
Teams stop trusting what they see and stop using the data for decisions.

Delays go unnoticed.
Baseline drift and missing dependencies make it impossible to trace causes of slippage.

Reporting breaks down.
Executives receive inconsistent information from project to project.

Risk analysis becomes meaningless.
If the data feeding a QSRA is flawed, the results are too.
The result is a project that reacts instead of predicts, wasting time and money reconciling conflicting versions of the truth.
This is not a minor issue. Industry studies show that poor data quality can inflate project costs by up to 20 percent and lead to major schedule variance. It’s the hidden cause behind the McKinsey statistic that 98 percent of projects finish late or over budget.
The Measurable Impact of Data Integrity
Our research across 1.2 million activities and 328 projects shows a clear and measurable link between data integrity and project performance.
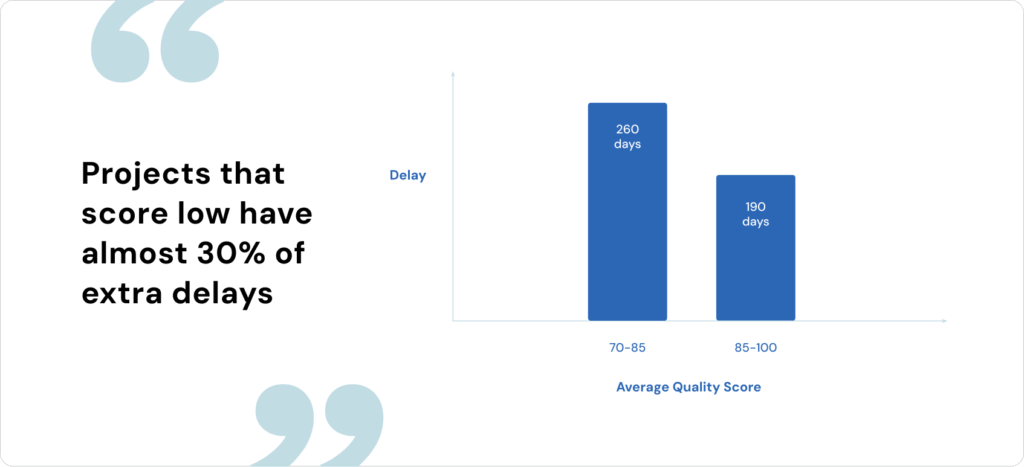
Projects that score low on schedule quality experience almost 30 percent more delay on average.
Improving a project’s average quality score from 70–85 to 85–100 reduces average delays by 70 days, which is nearly 10 weeks of earlier delivery.
This evidence proves what planners have long understood: better data quality leads directly to better delivery outcomes. When schedules are accurate, logical, and consistent, teams can detect risks earlier, make faster decisions, and prevent issues before they escalate.
Data integrity is not a compliance exercise. It is a performance driver. Projects with higher quality scores consistently achieve greater predictability, stronger cost control, and fewer claims.
That is why leading organizations treat schedule data quality as a core performance indicator rather than a task to complete.
What the Industry Is Doing Today

Across most organizations, data integrity still operates at Level 2 on the maturity ladder, which is what we call Tick-Box Assurance.
Checks are performed manually, often using a DCMA score checker, and treated as a one-time task. A check might be done when a project begins or during a periodic review, but rarely as an ongoing process. Issues are noted, but fixes only happen when someone asks for them.
This workflow is reactive and unsustainable. It depends on a handful of experts, varies by project, and provides no visibility into long-term data trends. It’s compliance-driven rather than performance-driven.
What Top 2% Organizations Are Doing Instead

The top-performing organizations, those consistently delivering on time and on budget, have evolved their approach to data integrity.
Here’s what that looks like in practice:
- Continuous validation. Every schedule update triggers an automated quality check.
- Standardization. Common rules and scoring thresholds are applied across all projects.
- Auditability. Every change is logged, tracked, and transparent.
- Trend visibility. Quality scores are monitored to identify recurring issues and early warnings.
- Integration. Data integrity connects directly with change management, risk control, and assurance reporting.
This is the difference between knowing a schedule was checked once and knowing it’s checked right now. It transforms data integrity from a manual task into a live system of assurance.
Proof in Practice: National Highways A303 Upgrade
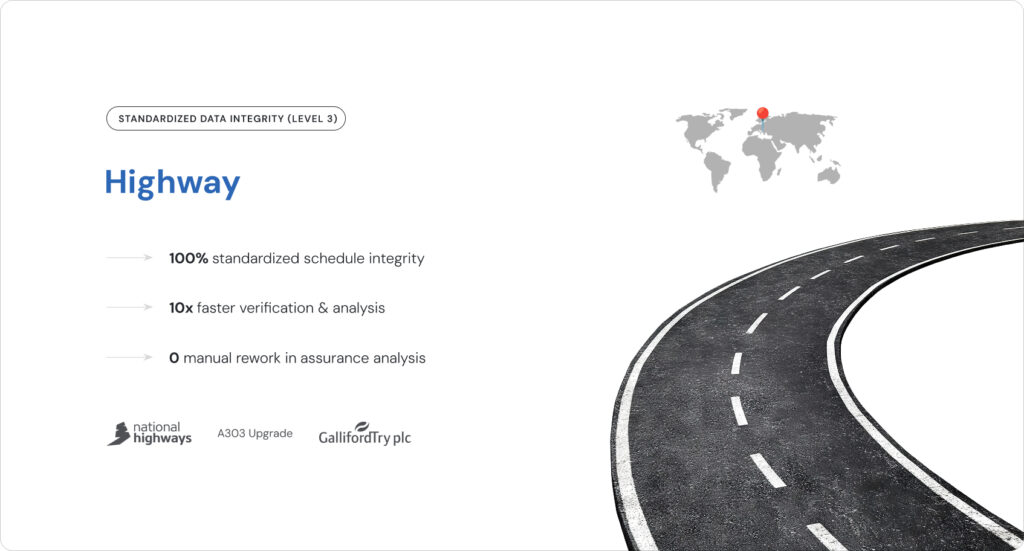
The A303 Upgrade project, delivered by National Highways and Galliford Try, is a clear example of what happens when automation replaces manual processes.
By adopting automated data integrity workflows through Nodes & Links, the project achieved:
- 100% standardized schedule integrity across all updates
- 10x faster verification and analysis cycles
- 0 manual rework in assurance analysis
That last metric tells the real story. When schedule data quality is automated, teams no longer waste hours correcting errors introduced by poor data. Every version of the schedule meets the same high standard, freeing planners to focus on insight, not inspection.
This is what it looks like to move from reactive, manual quality control to proactive, automated schedule assurance.
The Levels of Maturity in Data Integrity
The Data Integrity Maturity Ladder outlines how practices evolve and how risk exposure declines as assurance maturity increases:
| Level | Description | Typical Risk Exposure |
|---|---|---|
| 1. No Assurance | No health checks. Logic errors and unrealistic durations go unnoticed. | 30–80% cost overruns, 30–50% schedule overruns |
| 2. Tick-Box Assurances | Basic checks (e.g., DCMA) performed as one-offs. | 20–60% cost overruns, 20–40% schedule overruns |
| 3. Automated Assurance | Automated data checks at each update with audit logs. Standardized across project. | 10–40% cost overruns, 10–30% schedule overruns |
| 4. Integrated Assurance | Data integrity linked with change, risk, and reporting. Standardized across portfolio. | 0–10% cost and schedule overruns |
| 5. Proactive Organization | Data quality tracked, analyzed, and used to drive learning. | Often early or under budget |
The difference between Levels 2 and 4 can be the difference between project failure and predictable delivery. Automation not only improves schedule reliability but also enables measurable gains in time and cost performance.
The Benefit of Moving Up the Ladder
When organizations strengthen their data integrity, they gain:
- Predictability. More accurate schedules and forecasts.
- Efficiency. Less manual rework and faster assurance cycles.
- Transparency. A shared, trusted view of schedule health across teams.
- Continuous learning. Insights into patterns that inform training and standards.
As seen in the A303 Upgrade, eliminating manual rework creates compounding time and cost savings. Teams spend less time fixing data and more time using it to drive better outcomes.
Where Does Your Organization Stand?
Understanding your organization’s current level of schedule assurance is the first step toward improvement.
You’ll receive a benchmark of where your data integrity practices stand today and practical steps to move up the ladder toward consistent, data-driven project delivery.