Carbon profiles
Quantify the emissions that come from how the project is delivered, straight from the schedule.
Use cases
By organization
Featured stories
Latest from the blog
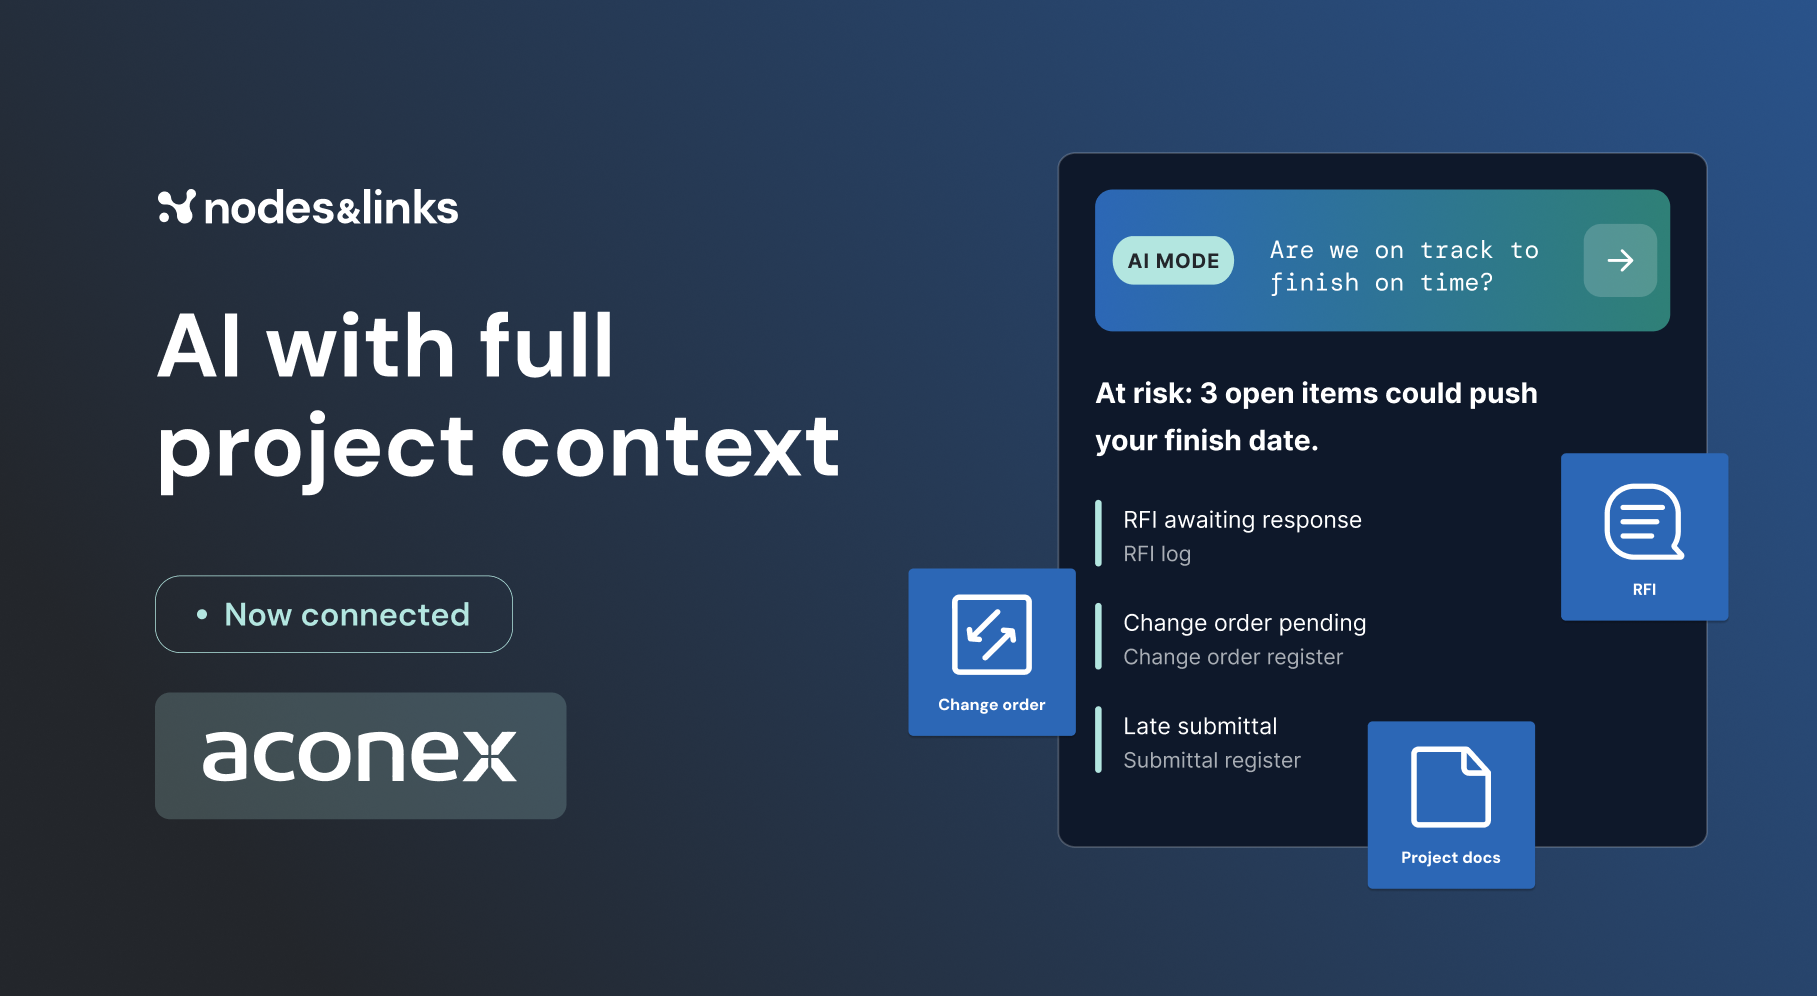
AI with full project context: Connect Nodes & Links with AconexNovember 5, 2026All blog posts →Featured guide
GuideThe Executive Guide to AI for Project DeliveryTest date confidence, understand project risk and focus interventions, with auditable evidence.Read the guide →All guides →Watch, read and learn
WebinarsLive sessions and on-demand replays.WhitepapersLong reads on where project delivery is going.ResearchThe peer-reviewed work behind the models.Case studiesHow teams use Nodes & Links on live projects.The Physics of Project AccelerationOur book on pulling project dates forward.All resources →Sustainability

Your schedules already hold the data. Nodes & Links turns it into a carbon footprint you can track, and decisions that bring it down.
Our measurable impact
What makes it different
Until now, teams had no way to measure carbon in real time, or model what a delay does to it.
Quantify the emissions that come from how the project is delivered, straight from the schedule.
See how a change, like a week-long delay, moves the carbon profile before you commit to it.
A knowledge layer for the decisions that cut emissions, from sequencing to resourcing.
Every day counts
Nodes & Links doesn’t cut emissions on its own. It’s the knowledge layer that helps teams minimize delays, optimize resources and put sustainability first, without giving up efficiency.
Carbon tracking
Calculated from the resources already in your schedule, with no extra work.
Why it matters to us
The built environment is responsible for a large share of global emissions, and planning and delivery are where the biggest decisions are made.
Tie carbon reduction and impact scores to your KPIs and progress tracking.
See the carbon cost of a delay, and the recovery that avoids it.
Build them into timeline, budget and resource planning from the start.
Analyze key decisions across every project for their effect on emissions.
One live view of carbon, alongside the schedule it comes from.
Consistent, sustainability-focused data across every team.