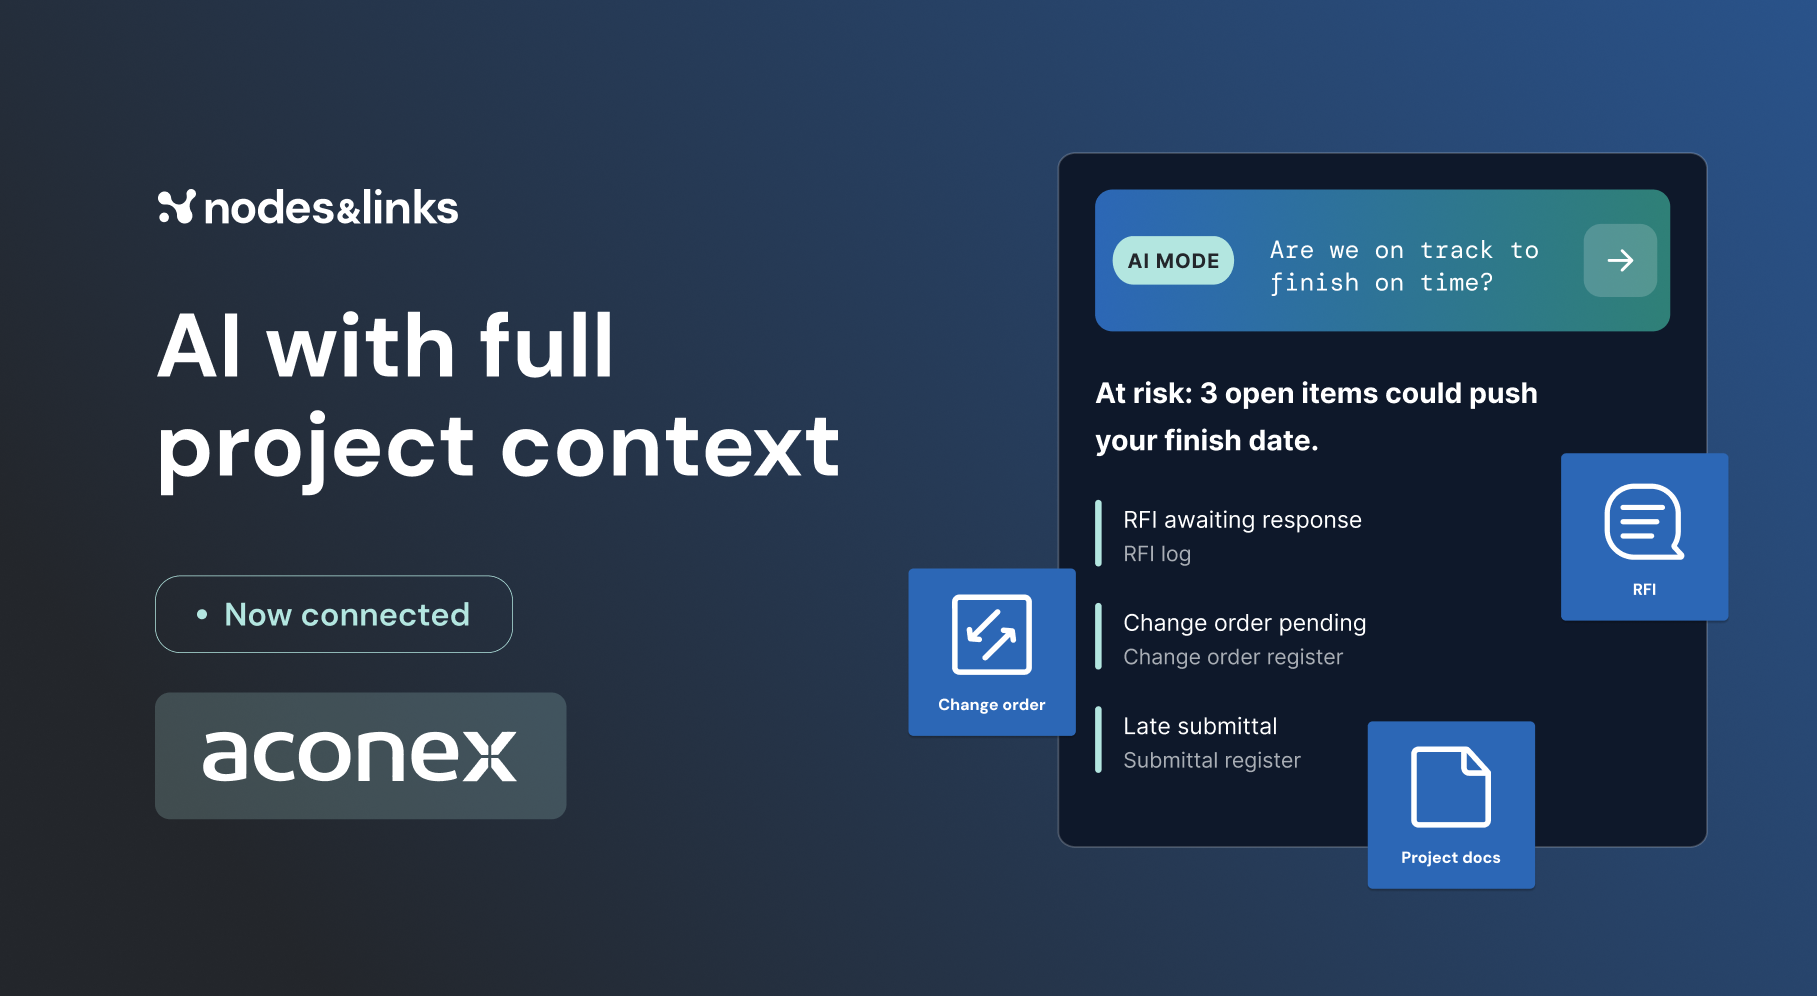
New: Document Integrations with Aconex and Procore are live. See what your AI can read now

Platform Ground truth models PAD Prediction

Schedule delay forecasting

Forecast finish dates from how your work is really performing.

PAD Prediction uses the actual performance of completed activities to forecast how long remaining work will take, and how late every WBS will finish.

DC Echo PAD Prediction
WBS: Construction
PLANNED COMPLETION
30 Sep 2027
PAD COMPLETION
15 Jan 2028
TOTAL DELAY
+107 days
PlanPAD

Why teams choose it

Three reasons it earns its place.

01

A forecast based on evidence.

PAD compares how long completed activities really took against plan, then applies that to the work still to come.

Actual ÷ planned
02

Delay, by every WBS.

See the predicted delay for every WBS or activity code, so the areas most likely to overrun are obvious.

WBS and activity codes
03

A basis you can share.

Click any forecast to see the completed activities behind it, and export them to justify the delay to anyone.

Excel export

Technical specification

How every forecast is built.

PAD
Actual duration ÷ planned duration, averaged across similar completed activities in the same WBS or activity code
Forecast
Planned duration × applied PAD for every remaining activity, giving PAD duration, increase and finish date
Hierarchy
WBS or activity code grouping, with total delay per node
Evidence
Moves up the hierarchy until there are enough completed activities to forecast
S-curve
Actual, plan, early and late band, and PAD forecast, with planned and PAD completion and total delay
Activity list
Planned duration, PAD, PAD duration, increase and finish date, plus optional columns, reorderable and exportable
Export
S-curve image, activity list and applied PAD details to Excel

The basis

Every forecast shows its working.

Click a PAD value to see which WBS or activity code level was used, the completed activities included and each one’s actual PAD, ready to export.

  • Similar completed activities
  • Applied PAD
  • Export
Applied PAD details
Export
APPLIED PAD
1.34
DURATION INCREASE
+4d
ID
SIMILAR COMPLETED
PLAN
ACTUAL
PAD
C.E.3016
Excavate and blind RC slab
6d
8d
1.33
C.E.3096
Install ducting and floor slab
10d
14d
1.40
C.E.3112
Rebar and pour, bay 2
8d
11d
1.38
C.E.3140
Rebar and pour, bay 3
8d
10d
1.25

By activity

See which activities will drive the overrun.

Every remaining activity gets a predicted duration, increase and finish date, so you know exactly where to focus mitigation.

  • PAD duration
  • Duration increase
  • PAD finish date
Activities, with their forecast
ACTIVITY
PLAN
PAD
PAD DUR.
INCR.
PAD FINISH
Install HV switchgear
20d
1.34
27d
+7d
4 Mar 2027
Terminate LV cabling
15d
1.34
20d
+5d
22 Mar 2027
Pre-commission tests
10d
1.12
11d
+1d
5 Apr 2027
Fit-out, data hall 2
30d
1.41
42d
+12d
28 May 2027

By WBS

The overrun, rolled up the tree.

Total delay sits beside every WBS or activity code node, so you can compare areas and drill into the one that needs attention.

  • Total delay per node
  • WBS or activity codes
Total delay by WBS
DC Echo
+107d
Design
+12d
Procurement
+48d
Construction
+107d
Data hall 1
+64d
Data hall 2
+107d
Commissioning
+31d

FAQ

Questions, answered.

Technical questions about PAD Prediction.

Talk to our team

Performance Against Duration: actual duration divided by planned duration, averaged across similar completed activities in the same WBS or activity code.

The applied PAD is multiplied by the planned duration of each remaining activity, giving a predicted duration, finish date and delay for every activity and every WBS.

PAD needs enough completed activities to be meaningful, so it moves up the hierarchy until there’s enough evidence to forecast.

Yes. Click any PAD value to see the completed activities it was calculated from, and export that list to Excel.