Use cases
By organization
Featured stories
Latest from the blog
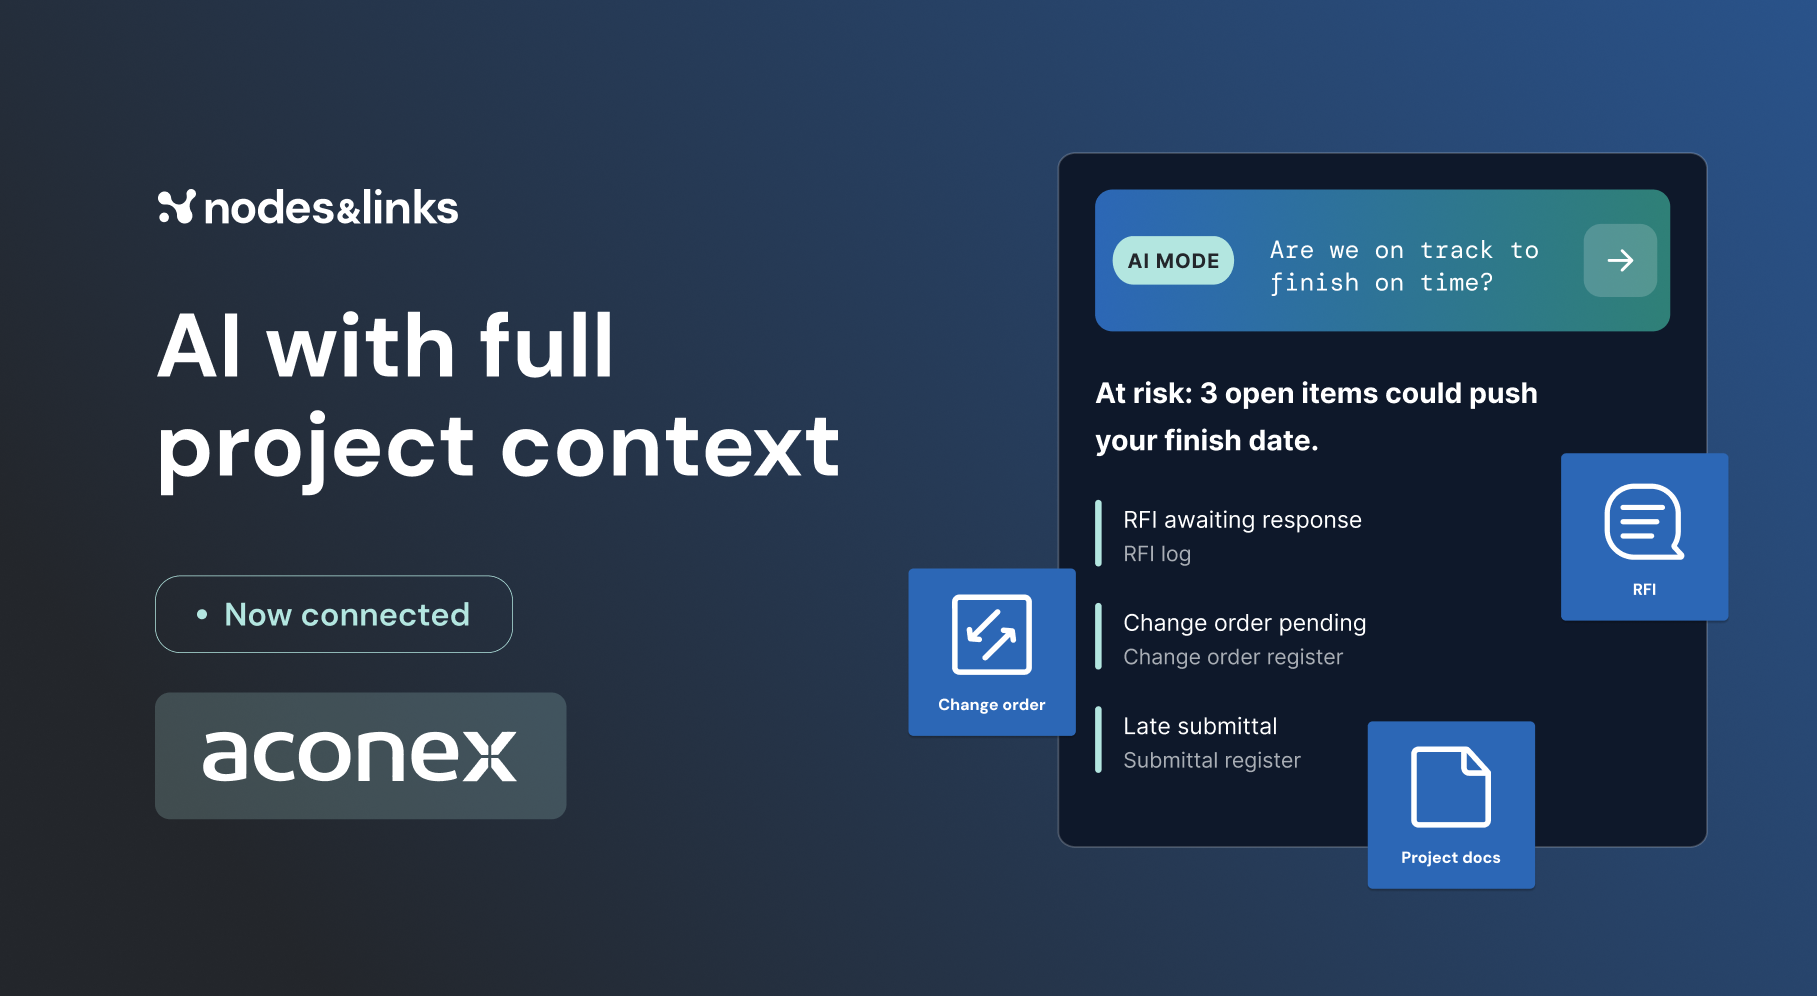
AI with full project context: Connect Nodes & Links with AconexNovember 5, 2026All blog posts →Featured guide
GuideThe Executive Guide to AI for Project DeliveryTest date confidence, understand project risk and focus interventions, with auditable evidence.Read the guide →All guides →Watch, read and learn
WebinarsLive sessions and on-demand replays.WhitepapersLong reads on where project delivery is going.ResearchThe peer-reviewed work behind the models.Case studiesHow teams use Nodes & Links on live projects.The Physics of Project AccelerationOur book on pulling project dates forward.All resources →Customer stories / PaCE
PaCE uses Nodes & Links AI to remove optimism bias from schedule forecasting, improving accuracy and enabling proactive risk management.
PaCE is a consultancy specializing in project controls across mining, oil and gas, petrochemicals and infrastructure, helping clients plan, forecast and manage complex projects.
This story covers PaCE’s work in oil and gas, where high-stakes, time-sensitive projects make accurate, actionable insight essential.
Optimism bias: human forecasts kept underestimating the time and resources the work would need.
The team used QSRA to get to the answer, with every result traceable to the schedule.
Each month, PaCE gathers up-to-date project data, tracking milestone completions, activity updates and any changes to forecasts.
The AI runs a quantitative schedule risk analysis to identify deviations between forecast and actual timelines, a monthly analysis that would be hard to sustain with traditional methods.
Milestones with the largest gap between the AI and human forecasts are flagged for investigation. Small deviations are deprioritized.
Mean absolute error on completed milestones
PaCE experts assess the flagged milestones and activities and develop targeted mitigation, so resources go where they are needed.
AI-driven findings are compiled into monthly assurance reports, giving clients actionable guidance to manage risk and maintain project timelines.
AI forecasts averaged 15 days of error per activity against 41 for human forecasts, and experts focused mitigation on the milestones with the widest gap.
The same risk and forecasting analysis, available to every team. Shown here as examples, not part of this story’s results.
Rank every project by how far its P80 date sits past the contract date.
The team used QSRA to get to the answer, with every result traceable to the schedule.
Each month, PaCE gathers up-to-date project data, tracking milestone completions, activity updates and any changes to forecasts.
The AI runs a quantitative schedule risk analysis to identify deviations between forecast and actual timelines, a monthly analysis that would be hard to sustain with traditional methods.
Milestones with the largest gap between the AI and human forecasts are flagged for investigation. Small deviations are deprioritized.
Mean absolute error on completed milestones
PaCE experts assess the flagged milestones and activities and develop targeted mitigation, so resources go where they are needed.
AI-driven findings are compiled into monthly assurance reports, giving clients actionable guidance to manage risk and maintain project timelines.
AI forecasts averaged 15 days of error per activity against 41 for human forecasts, and experts focused mitigation on the milestones with the widest gap.
The same risk and forecasting analysis, available to every team. Shown here as examples, not part of this story’s results.
Rank every project by how far its P80 date sits past the contract date.
The team used QSRA to get to the answer, with every result traceable to the schedule.
Each month, PaCE gathers up-to-date project data, tracking milestone completions, activity updates and any changes to forecasts.
The AI runs a quantitative schedule risk analysis to identify deviations between forecast and actual timelines, a monthly analysis that would be hard to sustain with traditional methods.
Milestones with the largest gap between the AI and human forecasts are flagged for investigation. Small deviations are deprioritized.
Mean absolute error on completed milestones
PaCE experts assess the flagged milestones and activities and develop targeted mitigation, so resources go where they are needed.
AI-driven findings are compiled into monthly assurance reports, giving clients actionable guidance to manage risk and maintain project timelines.
AI forecasts averaged 15 days of error per activity against 41 for human forecasts, and experts focused mitigation on the milestones with the widest gap.
The same risk and forecasting analysis, available to every team. Shown here as examples, not part of this story’s results.
Rank every project by how far its P80 date sits past the contract date.
“The ability to measure deviations between AI and human forecasts has transformed our risk management strategy.”
An answer is only useful if it holds up. Nodes & Links records the reasoning and model outputs behind every answer, so the team can see each step, check the math and share a recommendation that’s traceable.
Which milestones carry the highest risk of delay?
Yes. Every story comes from a real customer project. Some are anonymized to protect sensitive programs.
They’re listed under “Under the hood” on this page, with a link to the full use case.
Every project is different, but the same models and AI Mode are available to every customer. Book a demo to see them on projects like yours.
On the Customers page, where you can filter every story by use case.