
Every project carries uncertainty. Materials are delayed. Scope changes midstream. Teams adjust plans under pressure. These risks are unavoidable, but their impact doesn’t have to be.
The problem is not the presence of risk. It’s the lack of consistent visibility into how risk evolves throughout delivery.
Across the industry, risk control is still treated as a point-in-time activity, a box to tick before a gate review or funding release. Yet projects don’t move in snapshots. They move in real time.
That’s why Risk Control has become one of the most critical indicators of schedule assurance maturity.
What Risk Control Means in Scheduling
In scheduling terms, Risk Control refers to the continuous process of quantifying, monitoring, and managing uncertainty across the schedule.
The main tool for this has traditionally been Quantitative Schedule Risk Analysis (QSRA), a statistical approach that models uncertainty, identifies potential delays, and calculates confidence levels for project completion.
But in most organizations, QSRA is performed once or twice during a project’s lifecycle. After that, the model sits unused until the next major review.
In reality, risk is dynamic. It changes with every update, decision, and delay. True risk control means moving from static analysis to continuous monitoring, linking schedule, change, and data integrity to create an always-on picture of exposure.
Why Risk Control Matters
When risk control is weak, surprises are inevitable.
Projects experience sudden jumps in milestone delivery dates, frequent reforecasts, and recurring disputes over what went wrong. Decision-makers lose trust in forecasts, and teams spend valuable time reconciling numbers instead of mitigating risk.
The key issues are:
- Blind spots. Risks are analyzed too infrequently to catch evolving threats.
- Disconnected data. Schedule, change, and risk processes are siloed.
- Static models. QSRAs are based on outdated inputs and assumptions.
- Limited insight. Forecasts show probabilities but not the underlying causes.
These gaps lead to a cycle of reactive management, where actions lag behind events.
When risk control becomes integrated and continuous, however, uncertainty turns into foresight. Teams can identify emerging threats, test mitigation strategies, and take action before risks materialize.
What the Industry Is Doing Today
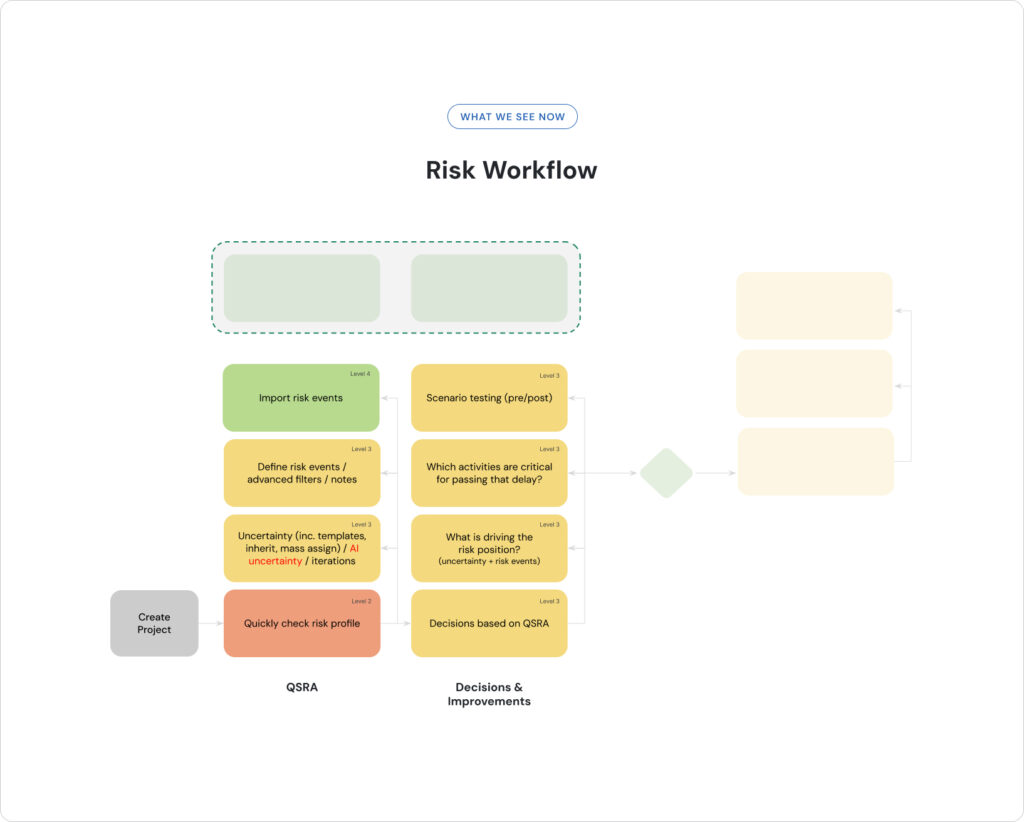
Most organizations are still operating at Level 2: Compliance Tick-Box.
They perform QSRAs at key milestones, often using templates or static inputs. A typical process includes:
- Checking a project’s risk profile manually
- Running one-off analyses using uncertainty templates
- Creating static P-positions and risk event charts
While this approach provides a snapshot of exposure, it quickly becomes outdated. By the time results are shared, new changes have already altered the risk landscape.
This approach can give the illusion of control while leaving teams flying blind between analyses, the very gaps where major delays and overruns emerge.
What Leading Organizations Are Doing Instead
High-performing organizations are transforming risk control into a real-time, data-driven function that’s fully integrated with schedule assurance.
Here’s what that looks like in practice:
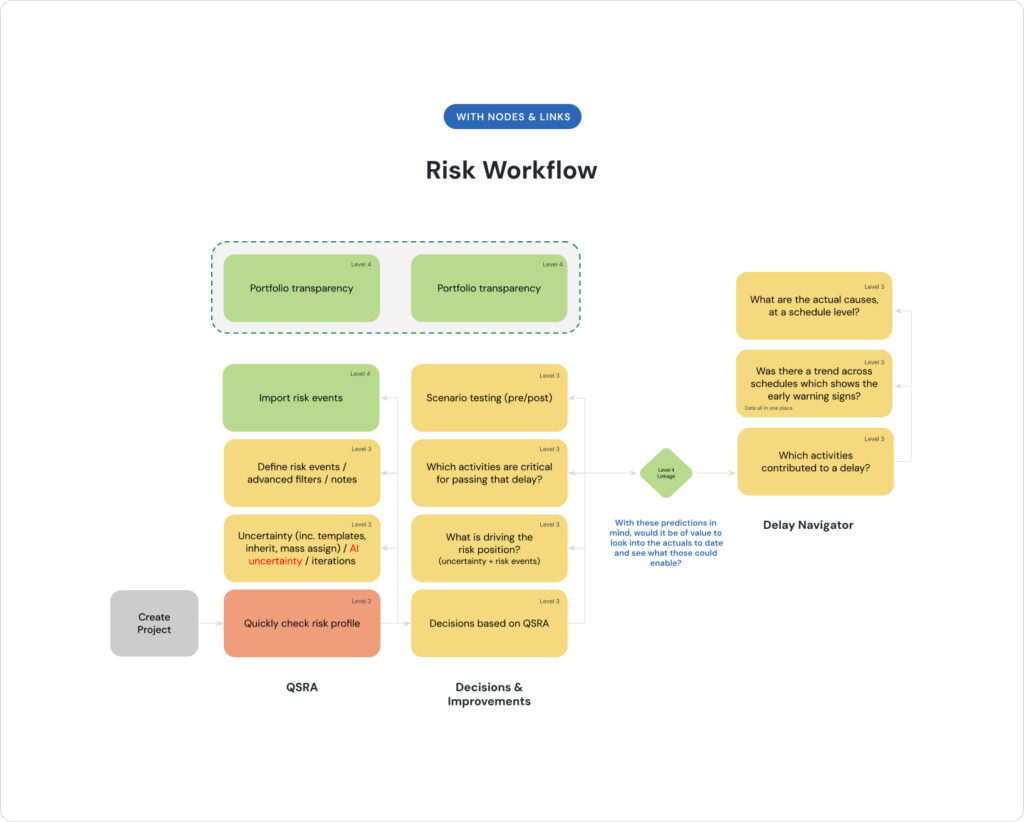
- Continuous risk input. Risk events and uncertainty data are automatically imported from project systems.
- Dynamic QSRA. Analyses run automatically with every schedule update.
- Scenario testing. Teams test mitigation strategies pre- and post-change.
- Causal insight. Risks are traced to the activities driving them.
- Portfolio transparency. Risk control is connected across all active projects.
This evolution turns risk control from a compliance exercise into a predictive performance engine. It allows leaders to see not just the probability of delay, but the precise causes, and what actions will reduce exposure.
Proof in Practice: Oil & Gas Mining Project
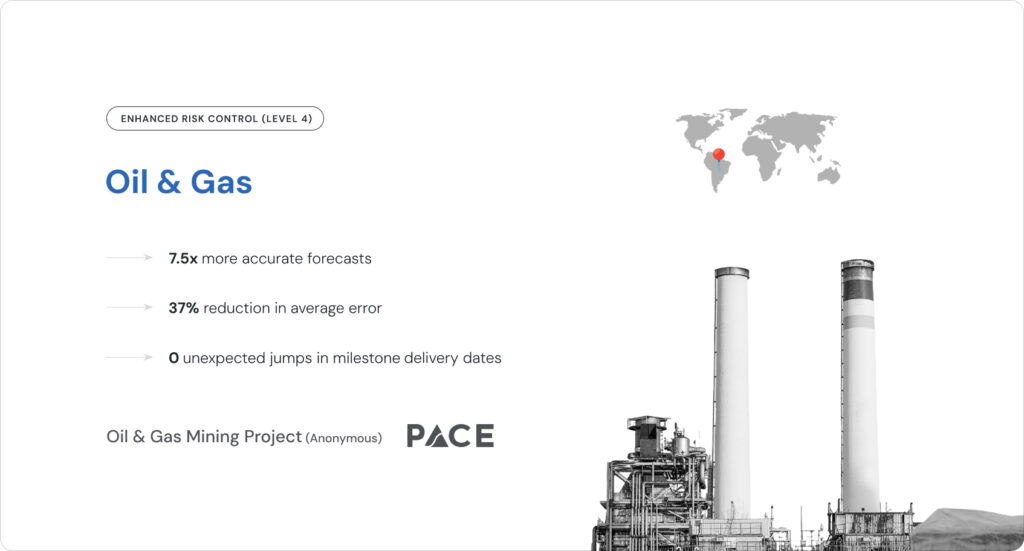
An anonymous Oil & Gas mining project, delivered in partnership with PACE, provides a clear example of what enhanced risk control looks like in action.
By introducing continuous, AI-enabled QSRA linked to live project data, the team achieved:
- 7.5x more accurate forecasts
- 37% reduction in average error
- 0 unexpected jumps in milestone delivery dates
Before automation, risk analyses were performed manually, often with outdated data and limited connection to actual project performance. The result was reactive mitigation and frequent reforecasting.
After automation, risk analysis became continuous. Each schedule update refreshed the QSRA automatically, with real-time insights flowing into decision-making.
This approach gave executives and project teams complete confidence in their forecasts, turning risk management from a defensive process into a strategic advantage.
The Levels of Maturity in Risk Control
The Risk Control Maturity Ladder outlines how organizations evolve from static assessments to continuous, predictive management.
| Level | Description | Typical Risk Exposure |
|---|---|---|
| 1. Blind Flight | No structured QSRA process. Major surprises and overruns expected. | Extreme — high likelihood of cost/schedule shocks |
| 2. Compliance Tick-Box | QSRAs performed as one-offs using templates. | High — systemic risks remain hidden |
| 3. Periodic Watchtower | Regular QSRAs with improved standards and mitigation tracking. | Moderate — foresight improving but still limited |
| 4. Continuous Guardian | AI-assisted risk control integrated with change, data integrity, and assurance. | Low — risks surfaced early, actions timely |
| 5. Learning Organization | Risk data drives forecasting, policy, and continuous learning. | Very Low — systemic resilience achieved |
Moving from Level 2 to Level 4 reduces average forecast error by up to 40 percent and nearly eliminates unplanned milestone shifts.
At Level 5, organizations no longer just manage uncertainty, they learn from it.
The Benefit of Moving Up the Ladder
When Risk Control becomes proactive and integrated, organizations unlock measurable advantages:
- Predictability. More accurate forecasts, fewer surprises.
- Accountability. Clear link between risks, activities, and decisions.
- Agility. Faster response to new threats and opportunities.
- Transparency. Shared understanding of exposure across teams and portfolios.
- Resilience. Lessons learned are embedded into future projects.
In the Oil & Gas project, automation transformed QSRA from a compliance report into a continuous assurance system, one that ensured milestone certainty and drove better outcomes.
Where Does Your Organization Stand?
Understanding your current level of Risk Control maturity is the first step toward eliminating surprises and improving confidence.
You’ll discover where your organization stands on the Risk Control ladder and what steps to take to achieve continuous, data-driven assurance.