Industry-standard methods
Monte Carlo simulation, the 14 DCMA checks, earned value and critical path analysis, continuously tested for accuracy. Recognized methods, not mystery math.
Use cases
By organization
Featured stories
Latest from the blog
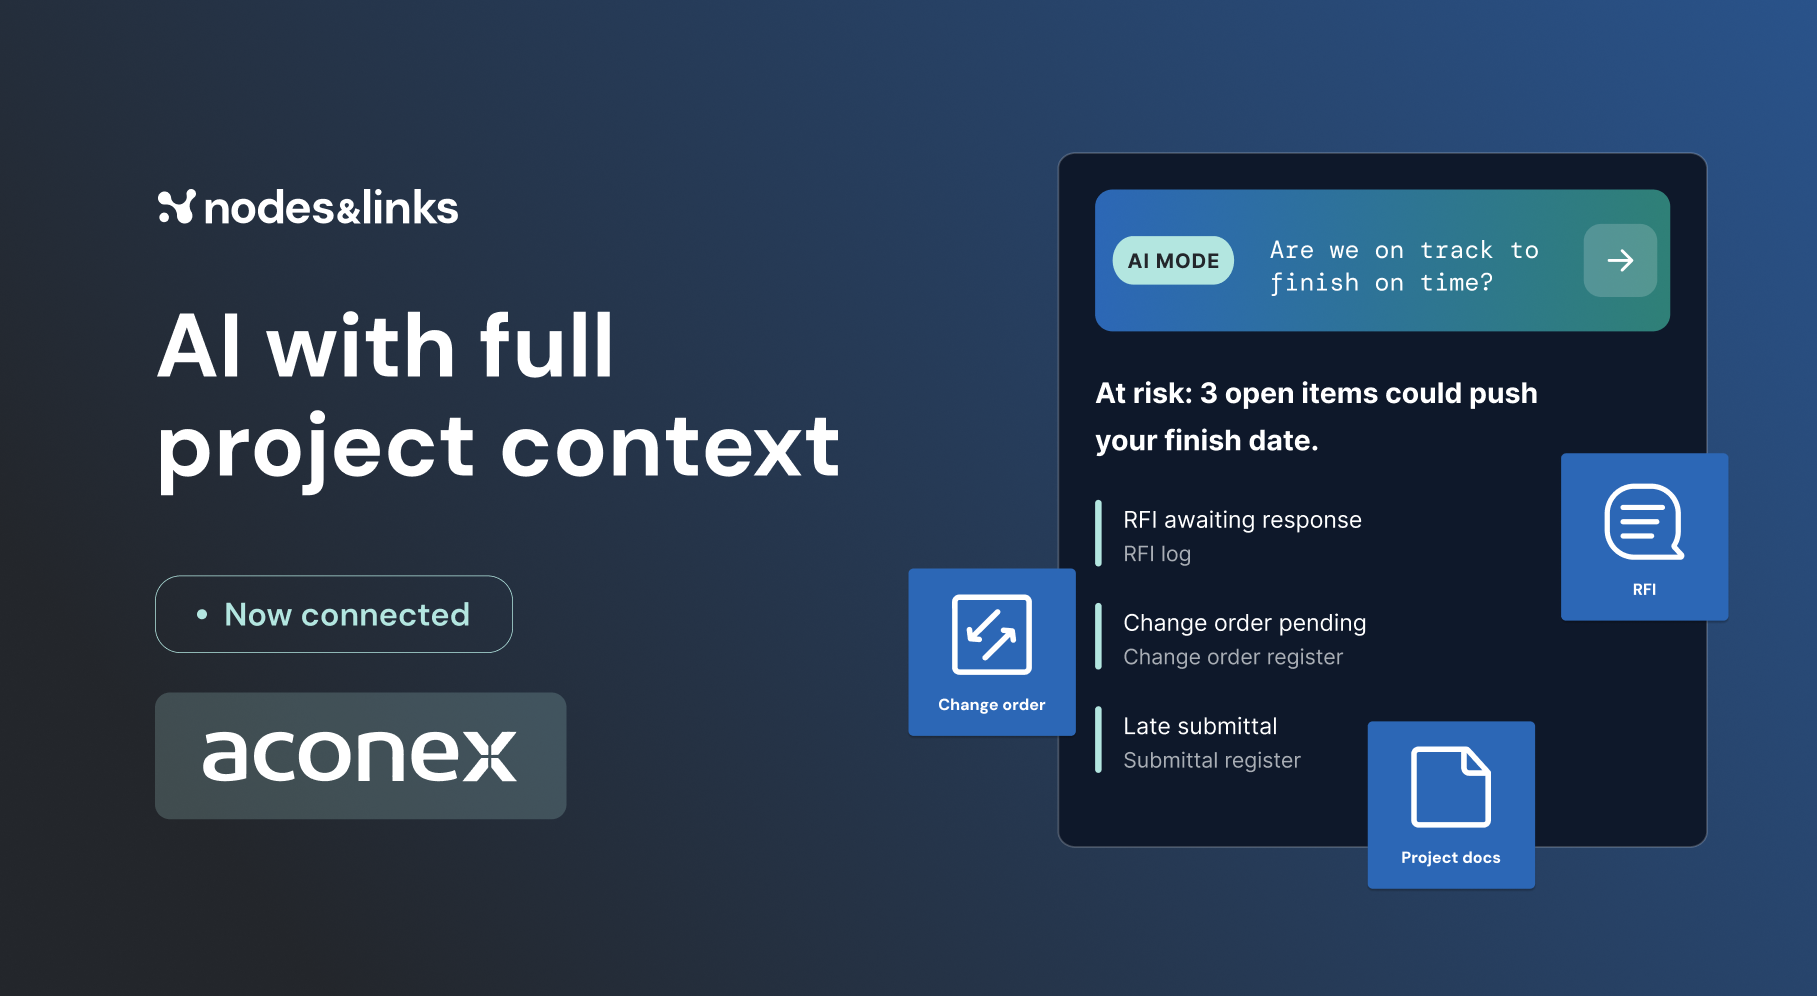
AI with full project context: Connect Nodes & Links with AconexNovember 5, 2026All blog posts →Featured guide
GuideThe Executive Guide to AI for Project DeliveryTest date confidence, understand project risk and focus interventions, with auditable evidence.Read the guide →All guides →Watch, read and learn
WebinarsLive sessions and on-demand replays.WhitepapersLong reads on where project delivery is going.ResearchThe peer-reviewed work behind the models.Platform coursesShort videos on getting more from the platform.The Physics of Project AccelerationOur book on pulling project dates forward.All resources →Platform / Ground truth models

Our AI never guesses. Every answer runs through industry-standard project controls models, built by scientists, continuously tested for accuracy and open for anyone to check.
Every expert model. One AI.
500,000+ hours of R&D
A glass box, not a black box
Monte Carlo simulation, the 14 DCMA checks, earned value and critical path analysis, continuously tested for accuracy. Recognized methods, not mystery math.
Set your thresholds, checks and critical path rules once, and every project is measured against them. If anyone changes the standard, you’ll see exactly what changed.
See the activities behind every number, the raw correlations behind every driver, and the dates behind every delay call.
Analysis never edits your source schedule. Even optimized schedules come back as a brand new file.
The models
Pick a model to see the method behind it and what your team can check for itself.
Runs every check across every WBS and activity, scoring each green, amber or red against your thresholds.
Go from the overall score to the exact activities failing any check, and export them in one click.
Every project is compared with your workspace default, so you know when anyone changes the standard.
Runs every check across every WBS and activity, scoring each green, amber or red against your thresholds.
Go from the overall score to the exact activities failing any check, and export them in one click.
Every project is compared with your workspace default, so you know when anyone changes the standard.
Measures planned against actual progress by WBS and activity code, with S-curves, activities per day and SPI.
Drill from any WBS straight down to the activities behind the number, and export the list.
SPI is actual progress divided by planned progress from your baseline, so the math is always visible.
Compares planned value, earned value and actual cost to show what the work done is really worth.
SPI, CPI, EAC, VAC and TCPI use standard formulas, so every figure traces back to PV, EV and AC.
Track earned value from the whole project down to one activity, and see when performance starts to slip.
Compares every activity between schedule versions and shows exactly which changes impacted the critical path, and how.
Open any activity for a side-by-side view, or follow every change and trend from baseline to finish.
Flags red flags like changed actual dates, progress going backwards and work marked done in the future.
Walks back from a late activity, re-running the schedule with baseline logic to isolate what each change caused.
Switch to Dates mode to see every raw date and make the call yourself, since contracts differ.
Separates the activities that actually cause delay from the ones that simply pass it along downstream.
Monte Carlo across 1,000 to 10,000 iterations, with BetaPERT, Triangle or Uniform estimates, risk events and pre and post mitigation.
Get P50, P80 and P95 dates and risk drivers. Our AI proposes three-point estimates you can accept or override.
Honors every calendar, constraint, lag and lead, handles constraints consistently with P6, and is continuously tested for accuracy.
Measures how strongly each activity and risk event moves your target date, then ranks them by share of impact.
Switch to the raw scores behind any bar at any time, so nothing is hidden by the ranking.
Split by duration uncertainty and risk events, for any activity in the schedule and any P-position.
Monte Carlo cost simulation of 10,000 iterations, with cost uncertainty and cost risk events on every directly costed row.
See P50, P80 and P95 costs for every WBS level and the whole project, pre and post mitigation.
Uses the same industry-standard simulation approach as QSRA, so schedule and cost risk tell one consistent story.
Forecasts remaining work from how long completed activities actually took against plan, in the same WBS or code.
Click any PAD value to see exactly which completed activities it was calculated from, every time.
Needs at least 10 completed activities, and moves up the hierarchy until it has enough evidence to forecast.
Proposes added personnel, added shifts or fast tracking only where feasible, with a written justification for each change.
You choose the goal, the intensity and the types of change, then review every single proposal yourself.
Your original schedule is never modified. Every optimized result comes back to you as a new XER file.
Built for real schedules
Each activity is scheduled on its own business calendar, including floats and relationship lags.
Handled consistently with major scheduling platforms, including Oracle Primavera P6.
Positive, zero or negative, applied on the right calendar for each relationship.
Float-based, or the longest path exactly as it comes out of your P6 file.
Cycles are detected and ordered so analysis still runs, and flagged so you can fix them.
Changed actual dates, progress going backwards and work marked done in the future.
Built by researchers, not just engineers
Our team’s published research papers form the foundation of our technology. Eight peer-reviewed papers on how delay and risk move through project networks. Fitting, for a company called Nodes & Links.
The standard float-based view of how delay spreads systematically underestimates the risk, because it ignores how the activity network is actually wired.
68,546 activities and 84,934 dependencies from a $1.86B infrastructure project
Authors: Dr. Christos Ellinas, Dr. Demetris Avraam, Dr. Christos Nicolaides
Read the paperThe standard float-based view of how delay spreads systematically underestimates the risk, because it ignores how the activity network is actually wired.
68,546 activities and 84,934 dependencies from a $1.86B infrastructure project
Authors: Dr. Christos Ellinas, Dr. Demetris Avraam, Dr. Christos Nicolaides
Read the paperOf six strategies tested for containing delay cascades, the timing of activities mattered more than how they are connected.
Authors: Dr. Christos Ellinas, Dr. Christos Nicolaides, Dr. Naoki Masuda
Read the paperA single delayed activity can knock on to as many as four more downstream, and the pattern of these cascades strongly predicts how a project performs overall.
Activity networks from 14 diverse, large-scale engineering projects
Authors: Dr. Marc Santolini, Dr. Christos Ellinas, Dr. Christos Nicolaides
Read the paperSmall local failures can trigger project-wide failure cascades far more often than expected, and local mitigation alone is not enough to contain them.
Real-world project data
Authors: Dr. Christos Ellinas
Read the paperShows that groups and clusters form naturally in networks that grow through local rules, the same way project schedules evolve.
Authors: Dr. Alexei Vazquez
Read the paperA single general method for working out how disruption spreads, or breaks apart, across many kinds of complex network.
Authors: Dr. Alexei Vazquez
Read the paperActivity durations and float follow predictable mathematical patterns, and getting the duration pattern right is essential to forecasting delay accurately.
118 construction projects
Authors: Dr. Alexei Vazquez
Read the paperSome project networks can be kept on track with a few targeted interventions. Others need intervention across a significant share of their activities. The math shows which is which.
Authors: Dr. Alexei Vazquez
Read the paperCo-founder and CTO
Co-founder and CEO
“I like that you can always drop out of AI mode and check the answers yourself, that tackles the hallucination concern.”
A proven project controls workflow, such as DCMA checks, QSRA or Delay Navigator, that the AI must use to answer. It’s what makes every answer traceable and defensible.
Every answer runs through the models and comes with its sources and evidence trail. You can open any answer in Platform Mode and check the math yourself.
Yes. Set your thresholds, checks and critical path rules once, and every project is measured against them. If anyone changes the standard, you’ll see what changed.
No. Analysis never edits your source schedule. Even Schedule Optimizer returns its results as a brand new XER file.
Our team of researchers and engineers, led by co-founder and CTO Dr. Christos Ellinas. The team has published peer-reviewed research on how delay spreads through project networks.