01
One click, no spreadsheets.
S-curves, activities per day and SPI for any WBS or activity code, without building a single report.
Project to activity
Use cases
By organization
Featured stories
Latest from the blog
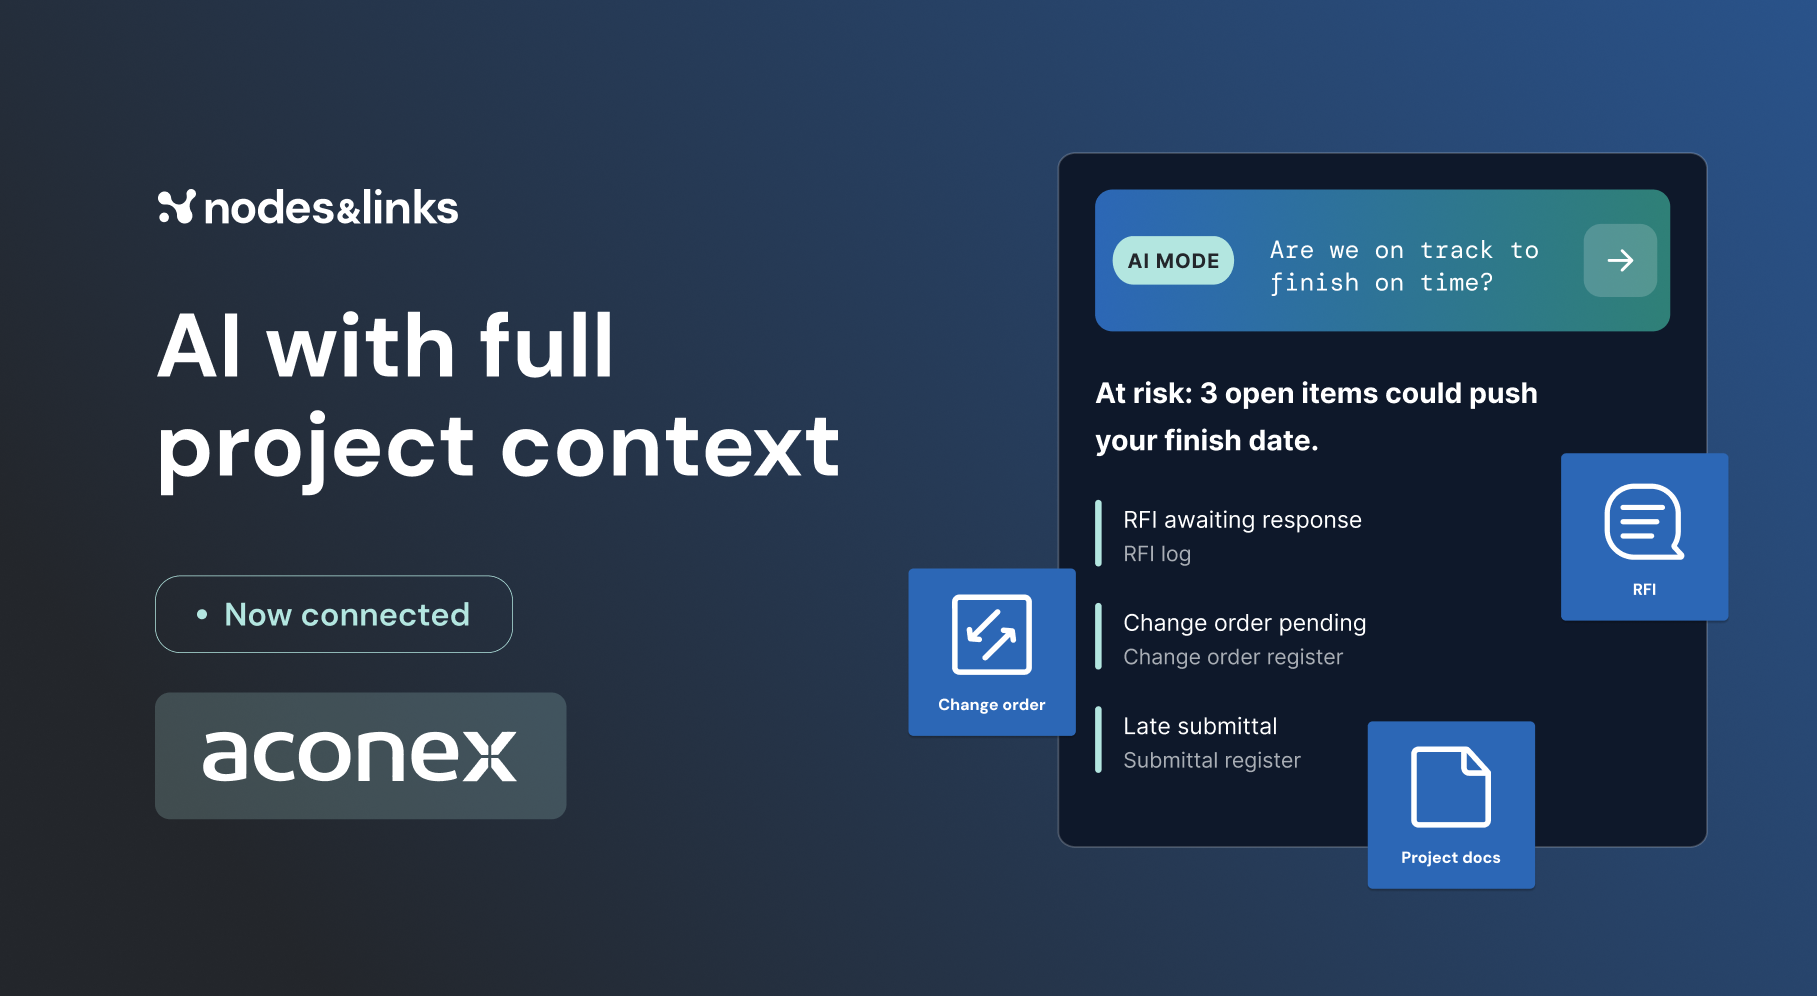
AI with full project context: Connect Nodes & Links with AconexNovember 5, 2026All blog posts →Featured guide
GuideThe Executive Guide to AI for Project DeliveryTest date confidence, understand project risk and focus interventions, with auditable evidence.Read the guide →All guides →Watch, read and learn
WebinarsLive sessions and on-demand replays.WhitepapersLong reads on where project delivery is going.ResearchThe peer-reviewed work behind the models.Platform coursesShort videos on getting more from the platform.The Physics of Project AccelerationOur book on pulling project dates forward.All resources →Platform / Ground truth models / Progress

Schedule progress tracking
Progress compares planned and actual progress for every WBS and activity code against your baseline, with S-curves, activities per day and SPI in one click.
Why teams choose it
S-curves, activities per day and SPI for any WBS or activity code, without building a single report.
Every WBS shows how far it is from baseline, so the areas furthest behind stand out before anyone asks.
SPI is actual progress divided by planned progress from your assigned baseline, and every figure drills to the activities behind it.
Technical specification
Configuration
Track by duration or by activities completed, group by WBS or by any activity code, and choose the time granularity that suits the schedule.
Activities per day
Baseline against current activities completed per day shows when a project falls behind and pushes the work into the future.
Falling behind early, then planning to catch up later: the pattern is visible at a glance.
Transparency
When later updates add scope, past progress is recalculated against the bigger total, so the trend reflects the real project, not the one reported at the time.
The completed work didn’t change. The total scope doubled, so it now counts for less, and the history shows it honestly.
By duration in days or by the number of activities completed, for the project, any WBS or any activity code, against your assigned baseline.
SPI is actual progress to date divided by planned progress to date from the assigned baseline. Above 1 means ahead, below 1 means behind.
If later updates add duration or activities, the total scope grows, so the same completed work counts for a smaller share. The work done hasn’t changed, the total has.
Yes. Select any WBS or activity code to see every activity in it, filter and customize the columns, and export the list to Excel.