01
The logic, not just the bars.
Click any activity to light up its incoming and outgoing links and open its details, with everything else fading back.
Focus on connections
Use cases
By organization
Featured stories
Latest from the blog
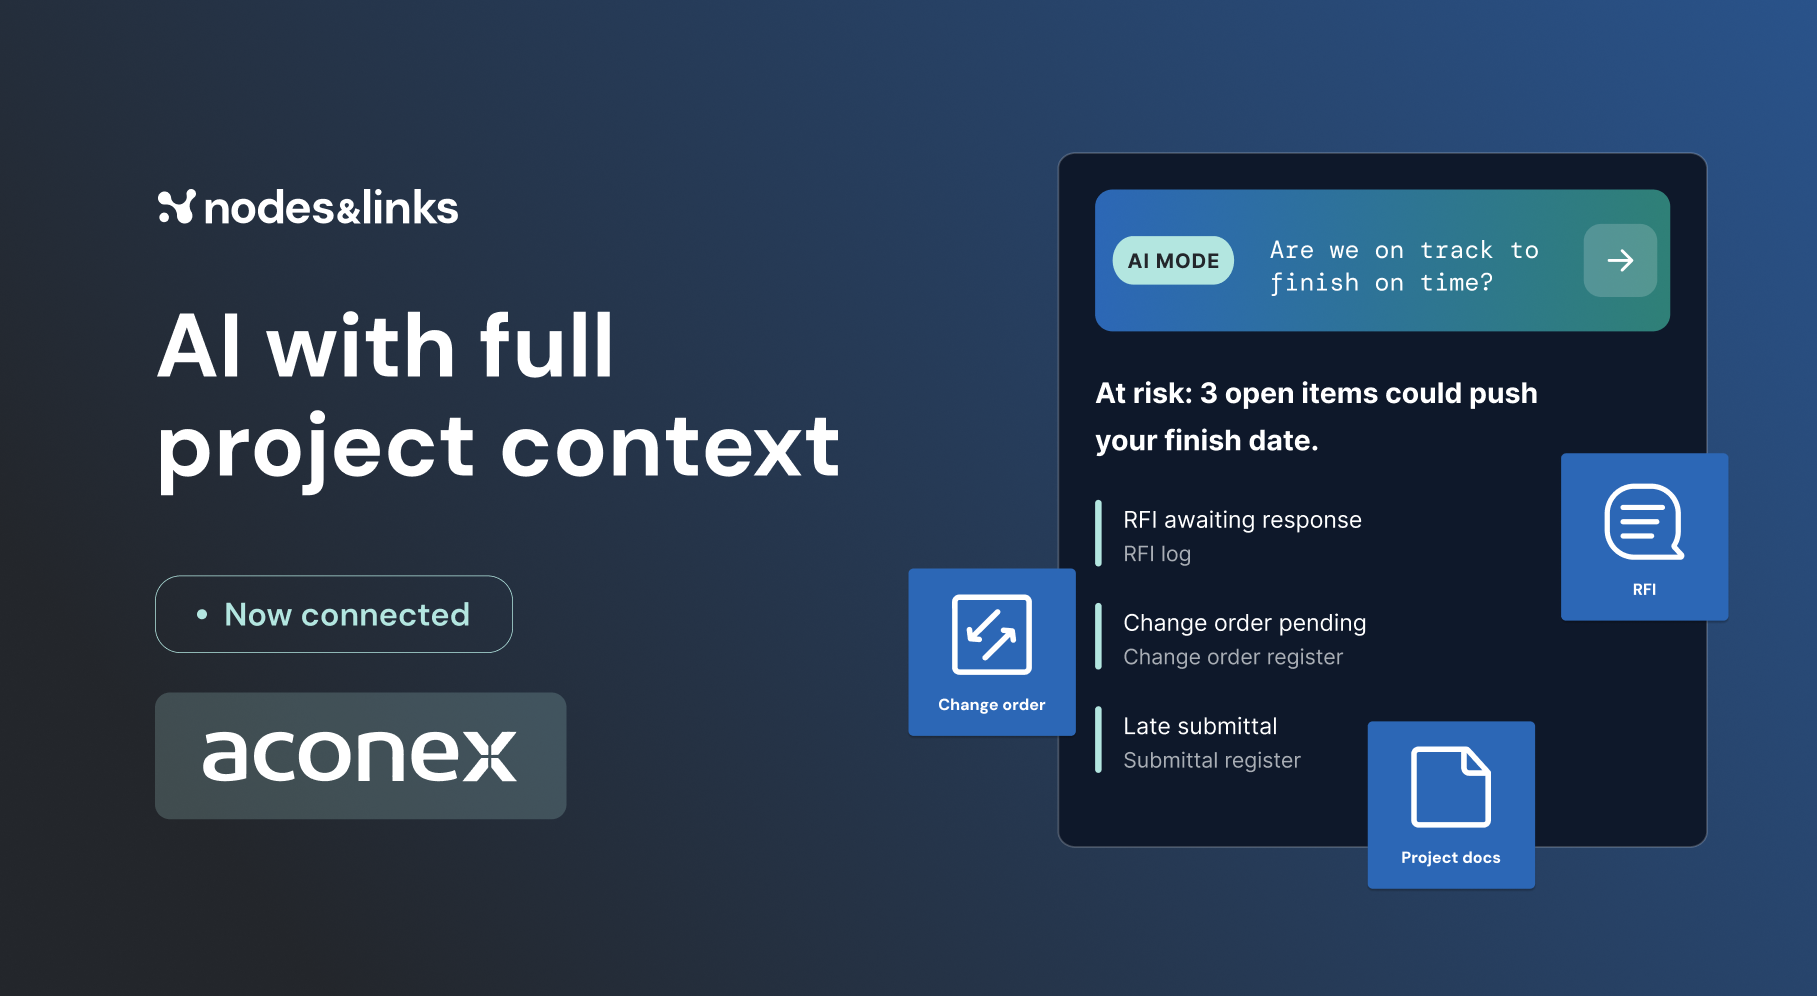
AI with full project context: Connect Nodes & Links with AconexNovember 5, 2026All blog posts →Featured guide
GuideThe Executive Guide to AI for Project DeliveryTest date confidence, understand project risk and focus interventions, with auditable evidence.Read the guide →All guides →Watch, read and learn
WebinarsLive sessions and on-demand replays.WhitepapersLong reads on where project delivery is going.ResearchThe peer-reviewed work behind the models.Case studiesHow teams use Nodes & Links on live projects.The Physics of Project AccelerationOur book on pulling project dates forward.All resources →Platform / Ground truth models / Connections

Schedule network analysis
Connections lays out every activity and relationship as an interactive network, so you can trace logic, spot the critical path and find out-of-sequence links in seconds, even on the biggest programmes.
Why teams choose it
Click any activity to light up its incoming and outgoing links and open its details, with everything else fading back.
Switch between a force-layout graph and a timeline that places every activity on a date axis, with today marked.
Filter, search and highlight the critical path on networks of 50,000 activities without the browser slowing down.
Technical specification
Critical path
Switch on Critical path and every critical activity and relationship turns red, everything else fades, and the view frames the path automatically.
Status
Turn on Status to color every activity by completed, in progress or not started, and see at a glance where work has stalled.
Timeline view
The timeline places every activity on a date axis by start date, with today marked, so out-of-sequence relationships stand out by severity.
Filters and scale
Apply predefined filters and see filtered and total counts side by side, on schedules up to 50,000 activities.
Your schedule as an interactive network: activities as circles, milestones as diamonds and relationships as arrows, in a graph or on a timeline.
Click it. Its incoming and outgoing relationships are highlighted, and the drawer opens with its status, floats, WBS path and relationships.
The same network placed on a date axis by start date, with today marked, so you can see how the work unfolds and spot out-of-sequence relationships.
Yes. Connections stays interactive on schedules of 50,000 activities, with filtered and total counts always shown.