01
Slippage, at a glance.
A line trending up means the activity is slipping, flat means it’s on track, and down means it’s ahead.
Up, flat or down
Use cases
By organization
Featured stories
Latest from the blog
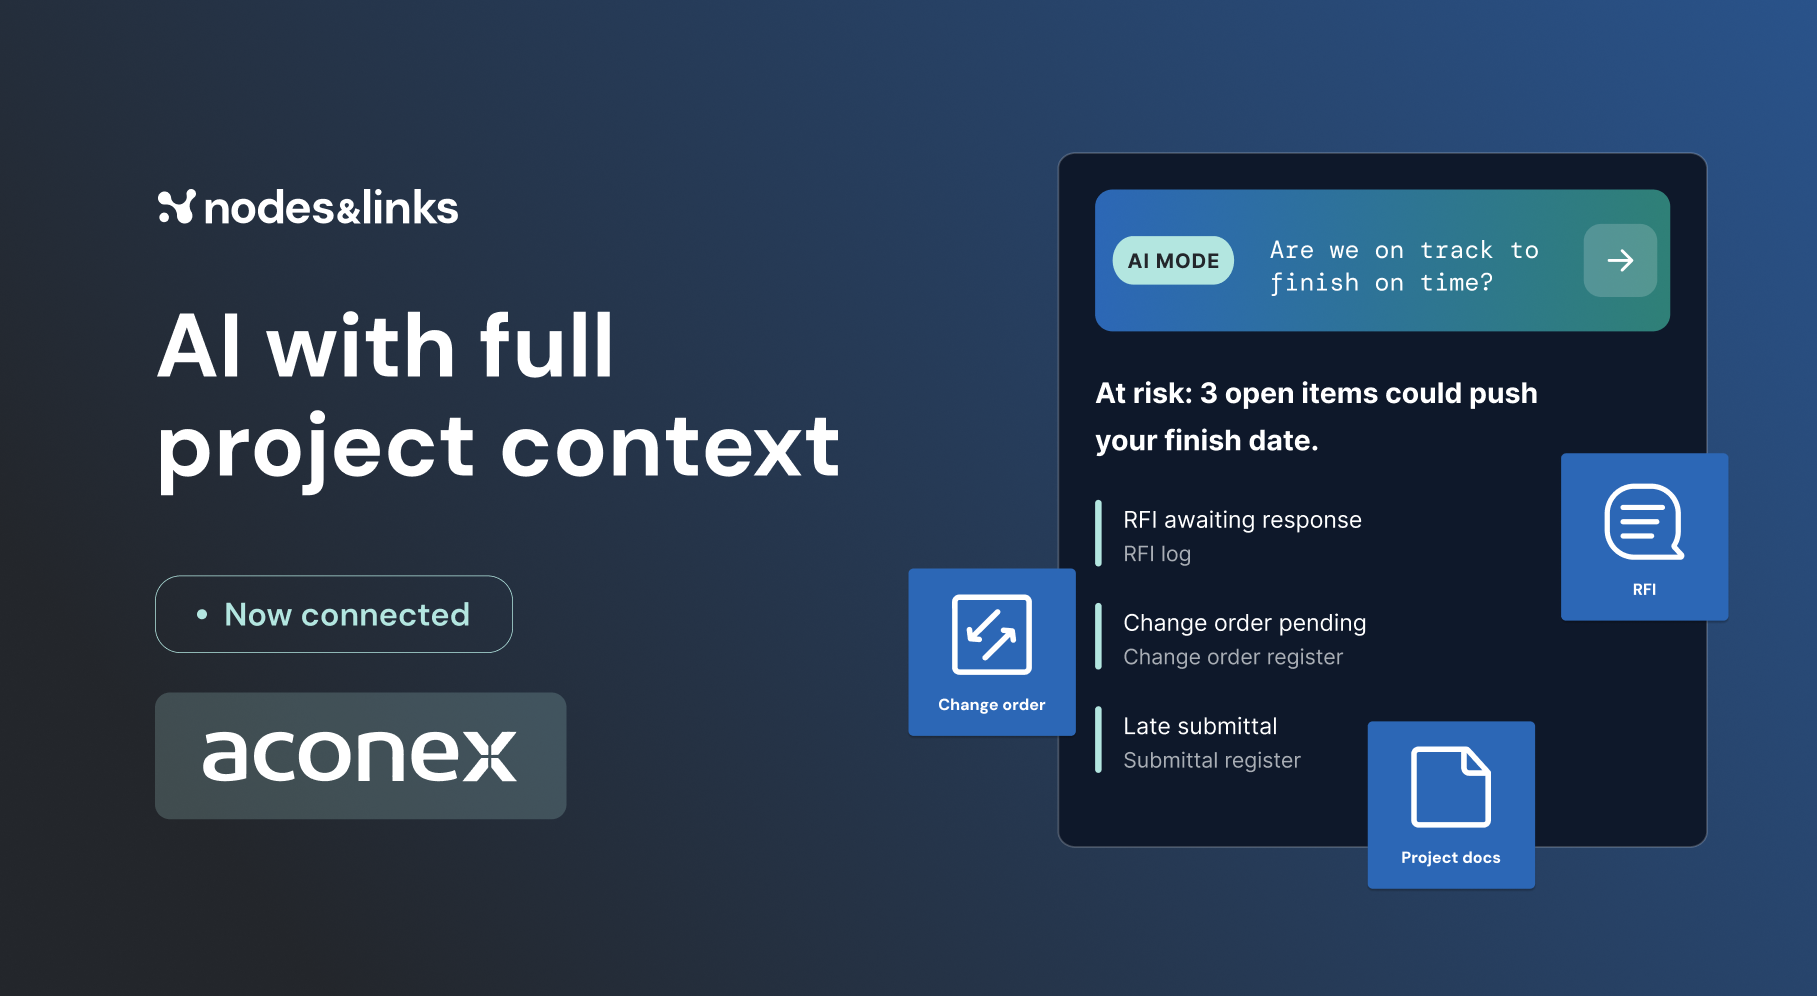
AI with full project context: Connect Nodes & Links with AconexNovember 5, 2026All blog posts →Featured guide
GuideThe Executive Guide to AI for Project DeliveryTest date confidence, understand project risk and focus interventions, with auditable evidence.Read the guide →All guides →Watch, read and learn
WebinarsLive sessions and on-demand replays.WhitepapersLong reads on where project delivery is going.ResearchThe peer-reviewed work behind the models.Case studiesHow teams use Nodes & Links on live projects.The Physics of Project AccelerationOur book on pulling project dates forward.All resources →Platform / Ground truth models / Trends

Milestone trend analysis
Trends tracks the finish dates of up to 10 activities across every schedule update, so you can spot slippage early, compare it with today and share it in one click.
Why teams choose it
A line trending up means the activity is slipping, flat means it’s on track, and down means it’s ahead.
Track up to 10 milestones or activities together, with baseline, latest finish and variance in one table.
Download the chart as an image or the data as Excel, or add it straight to an AI report.
Technical specification
Reading the chart
Each line follows one activity’s finish date across your updates, so the direction of the line is the story.
The table
Baseline finish, latest finish and variance sit beside the chart for every activity, so you can quote the exact slip.
Share
Export the chart as an image, the data as Excel, or add it to an AI report your team already sends.
Each line follows one activity’s finish date across your schedule updates. Trending up means it’s slipping, flat means it’s on track, and trending down means it’s ahead of schedule.
Up to 10 at a time. Remove one with its X, hide it from the chart with the eye icon, or reset the chart to start again.
Variance is the finish date on the latest schedule minus the finish date on the baseline, shown in days for every activity.
Yes. Download the chart as an image or all the chart data as Excel, or add the configured chart to an AI report.