New: Document Integrations are live. See what your AI can read now
Platform overviewOne AI. All your context. Proof behind every answer.Connects every schedule, document and standard you have, and checks every update 24/7.Explore the platform →
All use casesThe decisions that make or break projects.Pick the question your outcomes depend on. On one project or across your whole portfolio.See all use cases →
Use cases
Quality and complianceDoes this schedule meet our standards?Progress verificationIs the progress being reported real?Change managementWhat changed, and how did it affect my critical path?Risk and forecastingWhich risks are about to hit, and what do we do first?Delay recoveryWhich option gets the weeks back?Schedule accelerationWhere can we pull the date forward?Disputes and claimsCan we prove what caused the delay?


By organization
Clients and asset ownersOwners and operatorsHold every project to account.Which projects are most likely to miss their dates?For owners and operatorsGCs and Tier 1sGeneral contractorsCatch delays while they’re cheap to fix.Which changes are driving delays this month?For general contractorsPMO and project controls firmsConsultanciesScale your expertise, not your headcount.What did we learn on one program that every other needs?For consultancies
Featured stories


Latest from the blog
AI with full project context: Connect Nodes & Links with AconexNovember 5, 2026All blog posts →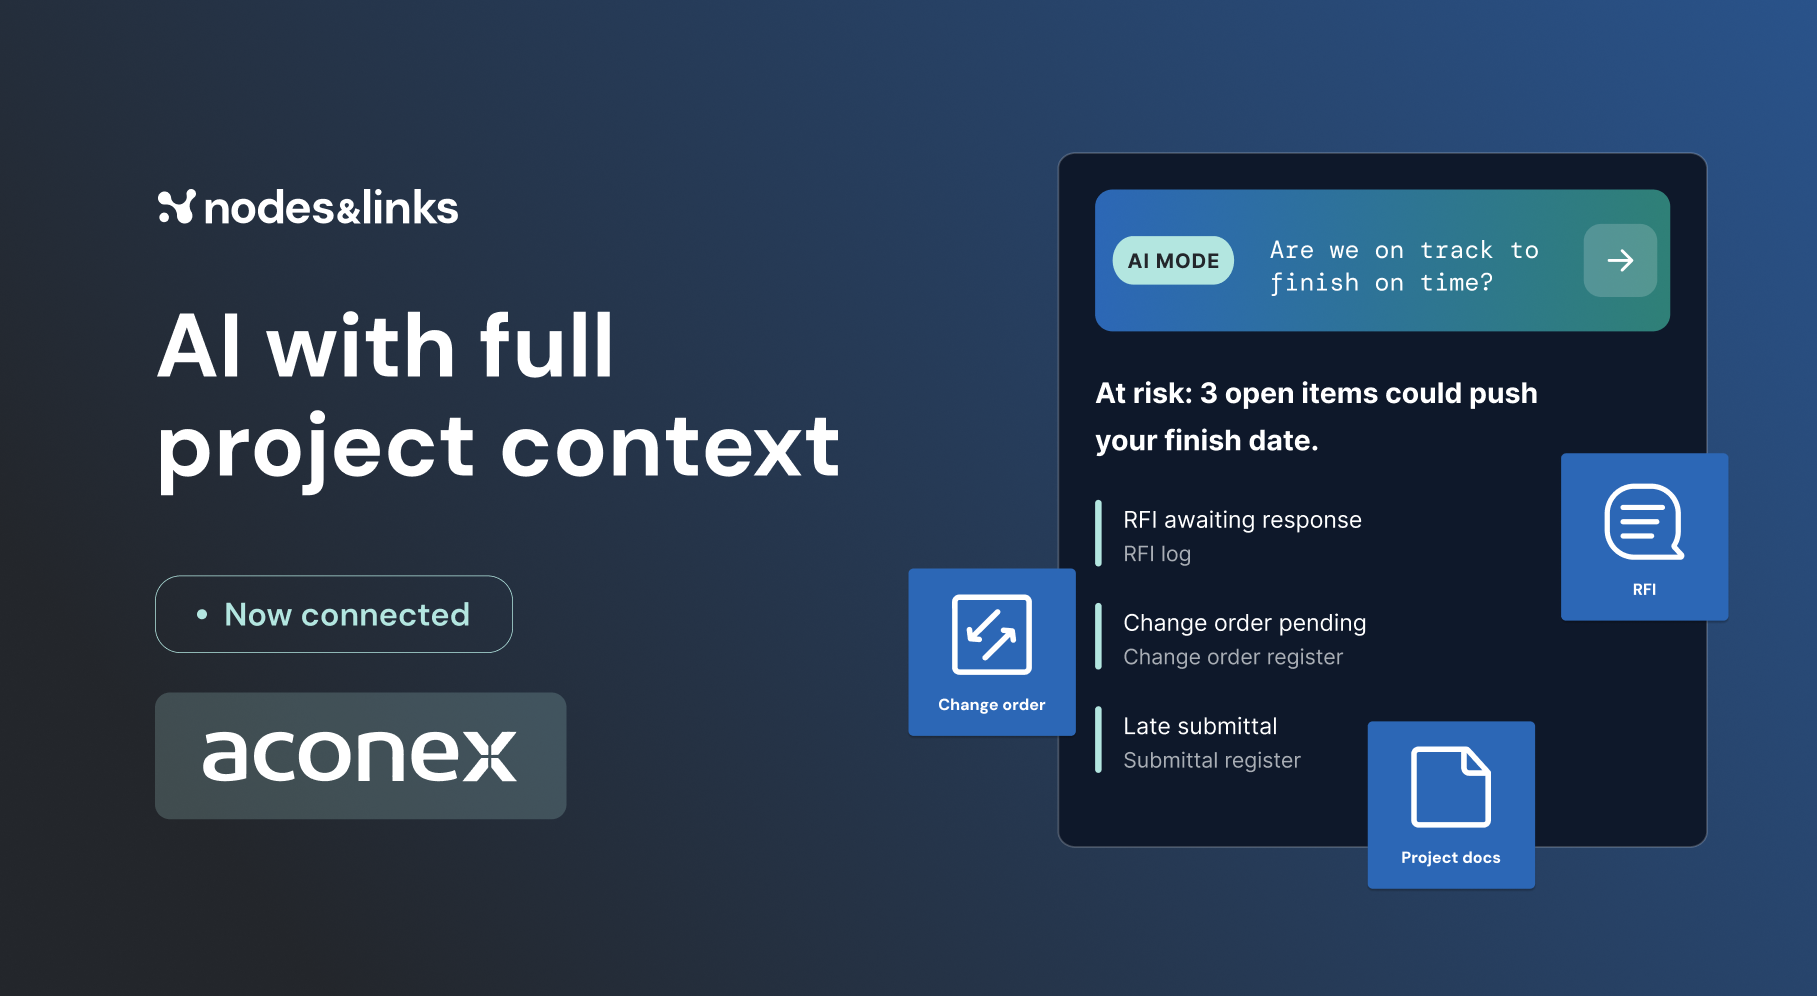
Featured guide
GuideThe Executive Guide to AI for Project DeliveryTest date confidence, understand project risk and focus interventions, with auditable evidence.Read the guide →All guides →Watch, read and learn
WebinarsLive sessions and on-demand replays.WhitepapersLong reads on where project delivery is going.ResearchThe peer-reviewed work behind the models.Case studiesHow teams use Nodes & Links on live projects.The Physics of Project AccelerationOur book on pulling project dates forward.All resources →Trust CenterEnterprise ready. Your data stays yours.Customer data is never used to train AI or LLM models.ISO 27001GDPRCyber EssentialsVisit the Trust Center →